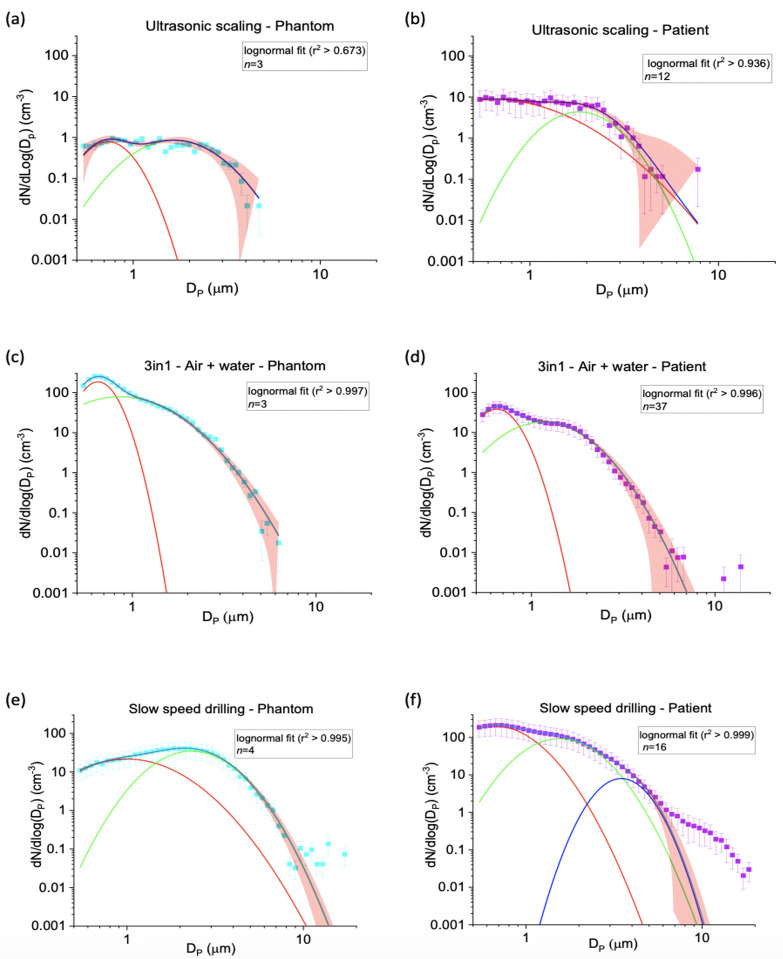
Fig 3.
Size distribution data for ultrasonic scaling (a, b), 3-in-1 (c, d) and slow-speed drilling (e, f). Mode 1 (red line), mode 2 (green line), mode 3 (dark blue line) and cumulative bi- or tri-modal fit (blue line). 95% confidence band is shown as the red shaded area, n = number of procedures and error bars represent (± standard error).

