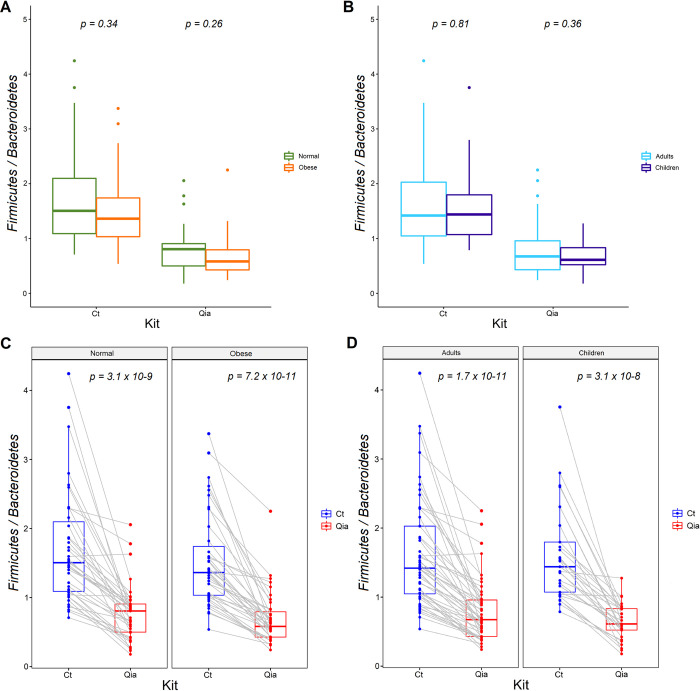
Fig 4. Firmicutes/Bacteroidetes (F/B) ratio of subgroups.
A. F/B ratio distribution between normal vs. obese group. B. F/B ratio distribution between adult vs. children group. C. F/B ratio distribution between Ct and Qia kits in Normal and obese groups, respectively. The gray lines represent the same sample pair. D. F/B ratio distribution between Ct and Qia kits in adults and children groups, respectively.

