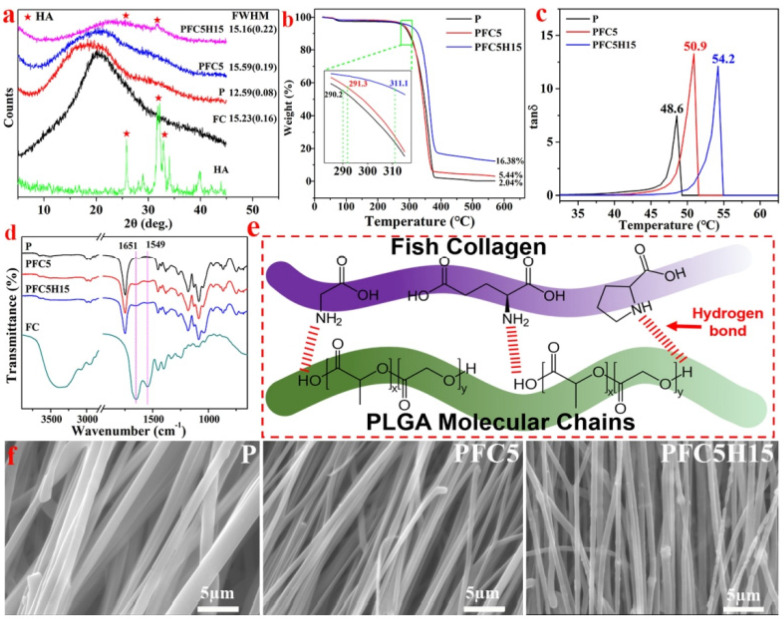
Figure 6.
(a) The X-ray diffraction (XRD) patterns of HA, FC, and three different membranes; (b) the TG curve and (c) the DMA curve of the membranes illustrating the characteristics; (d) the FTIR spectra and (e) a schematic diagram of the P, PFC5, and PFC5H15 membranes and FC; (f) the morphology of the edge of a fiber fracture, reprinted from Ref. [69].

