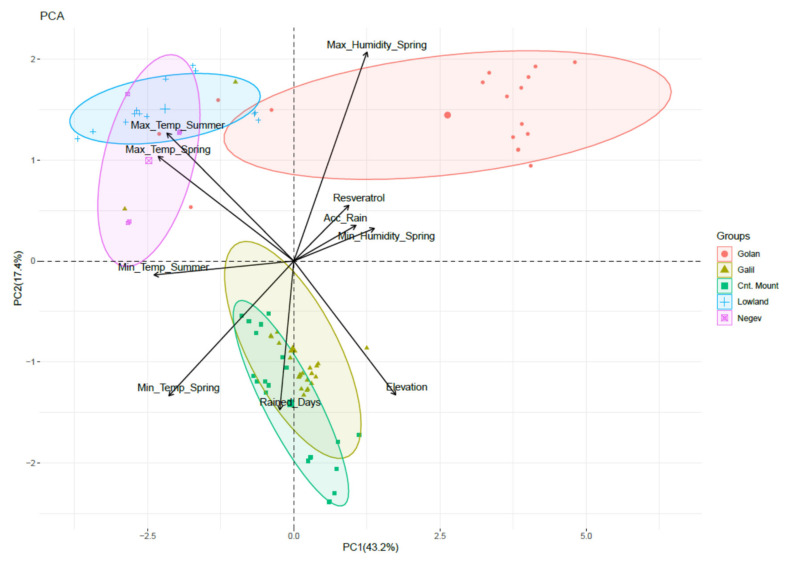
Figure 6.
Results of Principal Component Analysis (PCA), performed on the meteorological and chemical data set. Dots represent datasets for each specific vineyard. Arrows represent the vectors deriving the separation of the dots in the PCA. the Max_Temp_Summer-Maximal temperature Summer, Max_Temp_Spring-Maximal temperature Spring, Min_Temp_Summer-Minimal temperature Summer, Min_Temp_Spring-Minimal temperature Spring, Min_Humidity_Spring-Minimal Humidity Spring, Acc_Rain-Accumulated rain.

