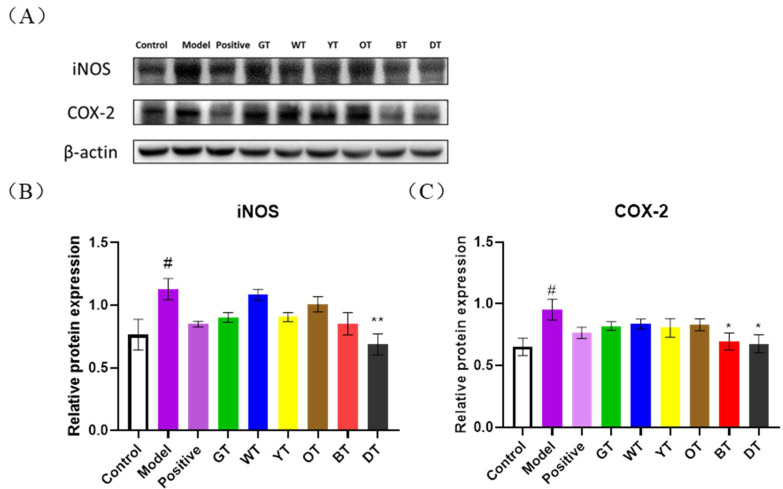
Figure 6.
(A) Immunoblot showing expression levels of iNOS and COX-2 proteins in the indicated groups and the quantification of (B) iNOS and (C) COX-2. β-actin was the loading control. Data are expressed as mean ± SEM of at least three independent experiments (n ≥ 5). # p < 0.05 versus control group; * p < 0.05 and ** p < 0.01 Tea-treated versus the Model group.

