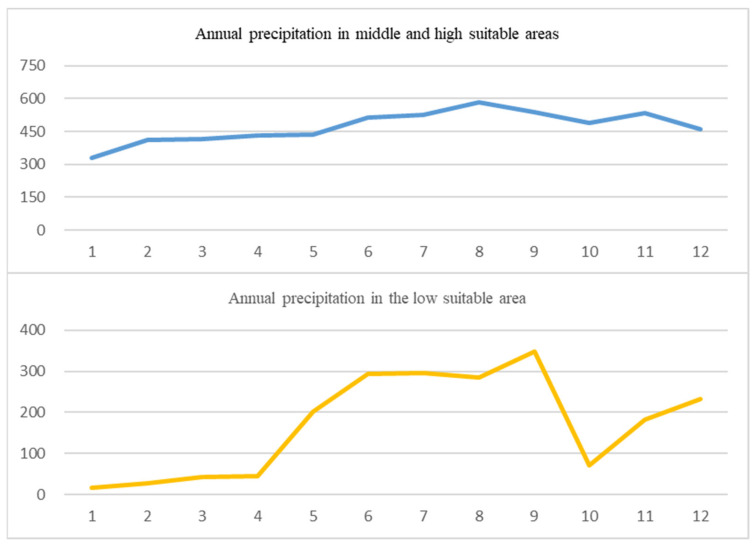
Figure 6.
Precipitation of 24 observation points in the middle- and high-suitability area and low-suitability area of the Qinghai–Tibet Plateau from 1952 to 2016. Blue represents the annual precipitation in medium- and high-suitability areas, Orange represents the annual precipitation in low-suitability areas.

