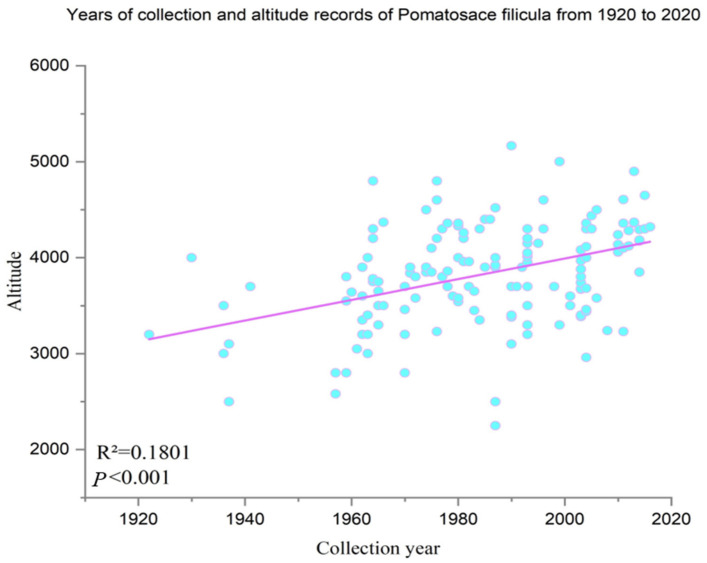
Figure 7.
Statistical year and elevation of P. filicula collected in 1920–2020. The blue dots represent the year in which the P. filicula were collected and the corresponding elevation; the blue dashed line represents the trend line of the elevation at which P. filicula was collected with increasing years.

