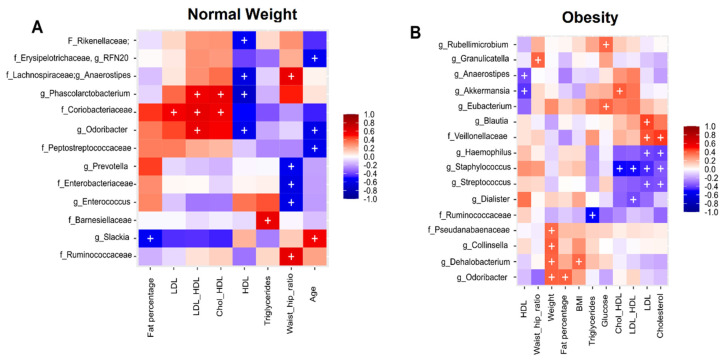
Figure 6.
Spearman correlations of clinical metadata and bacterial abundance during nopal diet intervention. (A) Correlation in the normal weight group (B) Correlation in the obesity group. The heat map shows correlation between bacterial taxa and numerical metadata. Columns show the numerical metadata. Rows show the bacterial taxa. The color key from blue to red indicates the correlation value between −1 to +1; −1 indicates negative correlation and +1 positive correlation. The symbol “+” denotes a significance of p < 0.05.

