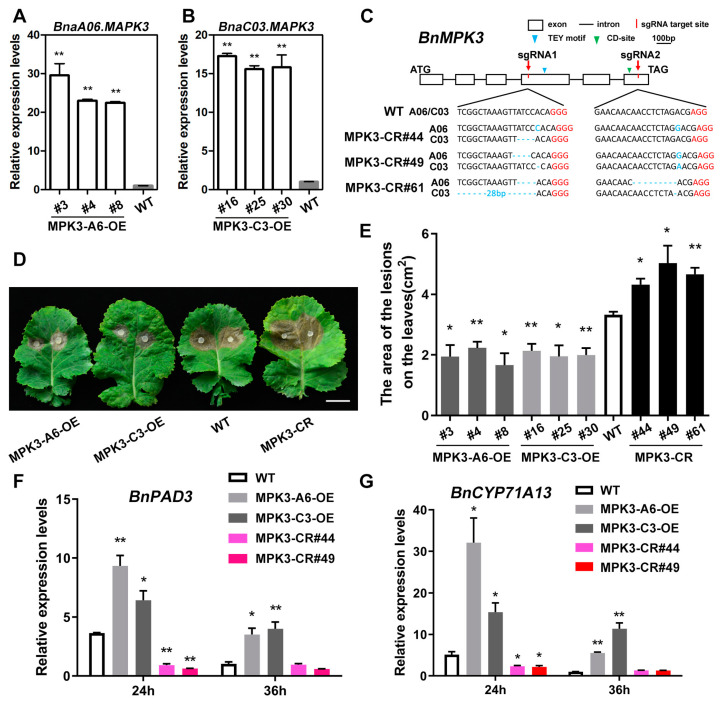
Figure 6.
Contribution of BnMPK3 to S. sclerotiorum resistance in B. napus. (A,B) BnaA06.MPK3 overexpression (MPK3-A6-OE) lines (A) and BnaC03.MPK3 overexpression (MPK3-C3-OE) lines (B) established using qRT-PCR analysis. The expression in WT plants as control. Data are shown as means ± SD (n = 3). Asterisks indicate significant differences compared with WT plants (t-test, ** p < 0.01). (C) A schematic diagram to show the characterization of the BnMPK3 exon/intron sequence and the target sites of sgRNAs. The edit types of three independent homozygous mutants (MPK3-CR#44, 49, and 61) are shown. The protospacer-adjacent motifs (PAM) are marked in red. TEY motif, phosphorylated by MKKs; CD-site, interacts with MKKs; ATG, start codon; TAG, stop codon. (D) Photographs of the lesions of detached leaves from BnMPK3 transgenic lines and WT plants in approximately 4 weeks when inoculated with 7 mm S. sclerotiorum hyphae agar block at 22 °C for 48 h. Scale bar, 2 cm. (E) Statistical analysis of the lesion areas of BnMPK3 transgenic lines and WT plants after 48 h inoculation. Data are shown as means ± SD (n = 3). Asterisks indicate significant differences compared with WT (t-test, * p < 0.05, ** p < 0.01). (F,G) Relative expression levels of two camalexin biosynthesis-related genes, BnPAD3 and BnCYP71A13, in BnMPK3 transgenic lines and WT plants after S. sclerotiorum inoculation for 24 h or 36 h. Data are shown as means ± SD (n = 3). Asterisks indicate significant differences compared with WT at corresponding time points (t-test, * p < 0.05, ** p < 0.01).

