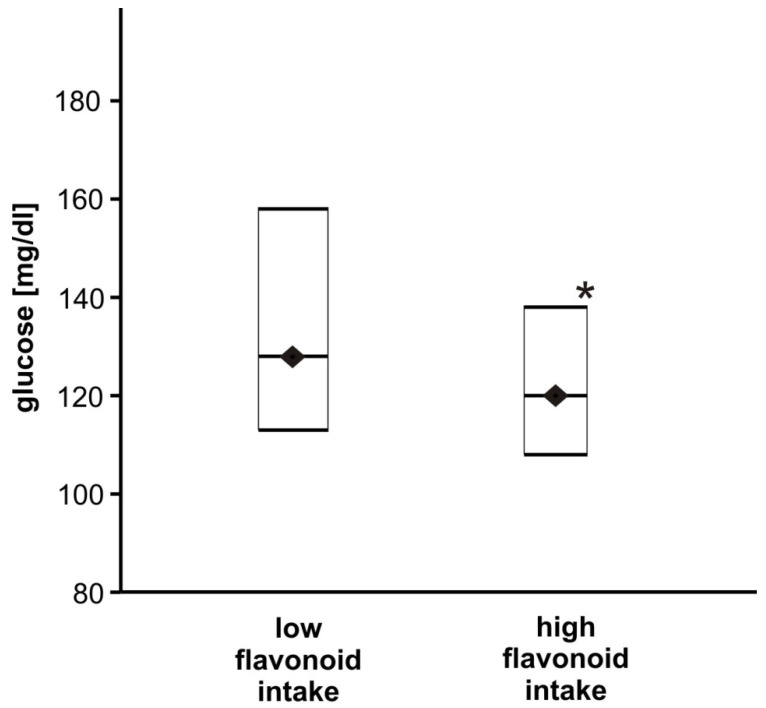
Figure 1.
The comparison of glucose concentration between T2DM patients with high and low flavonoid intakes. Data are shown as medians and interquartile ranges (Q1; Q3). The glucose concentration was significantly lower for the high flavonoid intake group (n = 65) compared to the group characterised by low flavonoid intake (n = 64), * p < 0.05.

