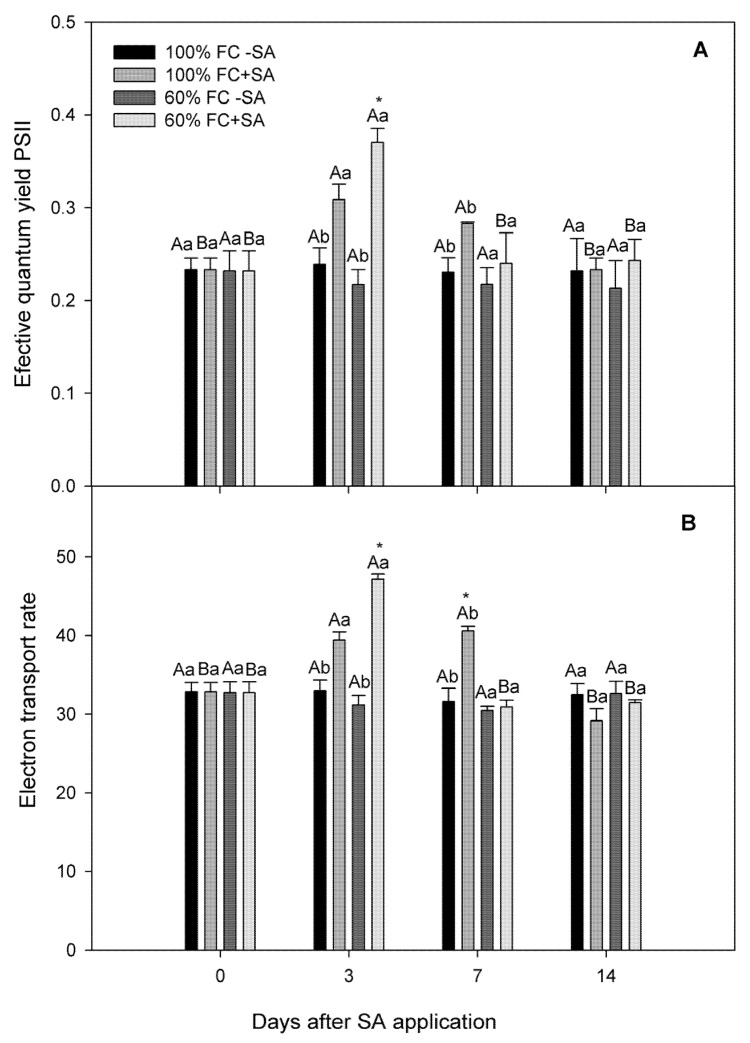
Figure 2.
Photochemical parameters in A. chilensis plants grown under 100% and 60% FC and two SA doses (0 and 0.5 mM) at different times. (A) effective quantum yield (ΦPSII) and (B) electron transport rate (ETR). The bars are means ± SE (n = 3). Different uppercase letters indicate significant differences among days for the same SA and irrigation treatment according to Tukey’s test (p ≤ 0.05). Different lowercase letters indicate significant differences between SA treatment for the same irrigation treatment and time post SA application according to Tukey’s test (p ≤ 0.05). According to Tukey’s test, asterisks indicate significant differences between irrigation treatments of the experiment for the same SA treatment and time post SA application (p ≤ 0.05).

