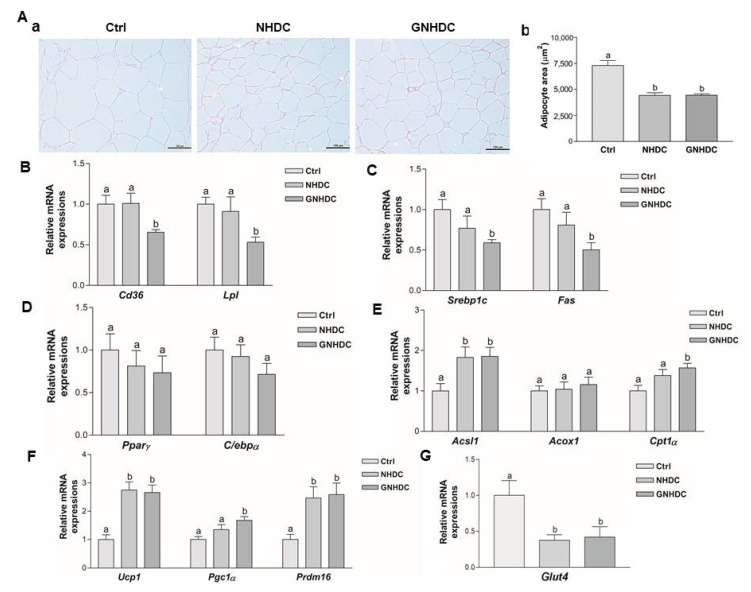
Figure 3.
Effects of NHDC and GNHDC on the subcutaneous adipocyte area and the gene expressions for lipid metabolism in subcutaneous adipose tissues. Subcutaneous adipose tissues were analyzed by (A) (a) H&E staining (magnification 200×, scale bar 10 μm) with Ctrl, NHDC, and GNHDC. (b) Adipocyte area of subcutaneous adipose tissues was quantified (n = 3 per group). Expression levels of mRNA were analyzed for (B) fatty acid uptake-related genes, Cd36 and Lpl, (C) lipogenesis-related genes, Srebp1c and Fas, (D) adipogenesis-related genes, Pparγ and C/ebpα, (E) β-oxidation-related genes, Acsl1, Acox1, and Cpt1α, (F) fat browning-related genes, Ucp1, Pgc1α, and Prdm16, and (G) the insulin-responsive glucose transporter gene, Glut4. All data (B–G) are shown as the mean ± SEM quantified (n = 9 per group) and were analyzed by one-way ANOVA with a Newman–Keuls post hoc test. Acox1, acyl-CoA oxidase 1; Acsl1, acyl-CoA synthetase long-chain family member 1; Cd36, cluster of differentiation 36; C/ebpα, CCAAT/enhancer binding protein alpha; Cpt1α, carnitine palmitoyltransferase 1 alpha; Fas, fatty acid synthase; H&E, hematoxylin and eosin; Lpl, lipoprotein lipase; Pgc1α, peroxisome proliferator-activated receptor gamma coactivator 1 alpha; Pparγ, peroxisome proliferator-activated receptor gamma; Prdm16, positive regulatory domain 16; Srebp1c, sterol regulatory element-binding protein 1; Ucp1, uncoupling protein 1; Glut4, glucose transporter type 4; Ctrl, db/db mice control; NHDC, db/db mice with neohesperidin dihydrochalcone supplement; GNHDC, db/db mice with NHDC-O-glycoside supplement. The same letter indicates no significant differences (p > 0.05) and different letters indicate significant differences (p < 0.05, ANOVA).

