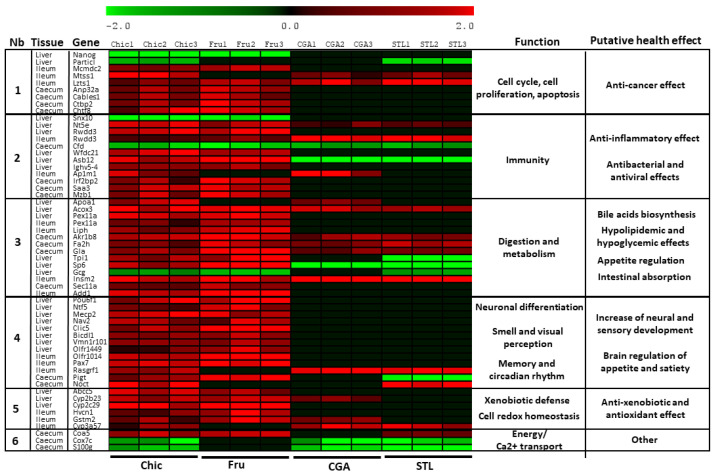
Figure 1.
Gene expression profiles in hepatic tissue, ileum cells and caecum of mice after different diets. Log2 fold change of gene expression was represented individually for mice (1–3) and gene-related physiological processes and putative health effect are represented on the right part of the graph. Chic—chicory flour diet; Fru—fructose diet; CGA—chlorogenic acids treatment; STL—sesquiterpene lactones treatment.

