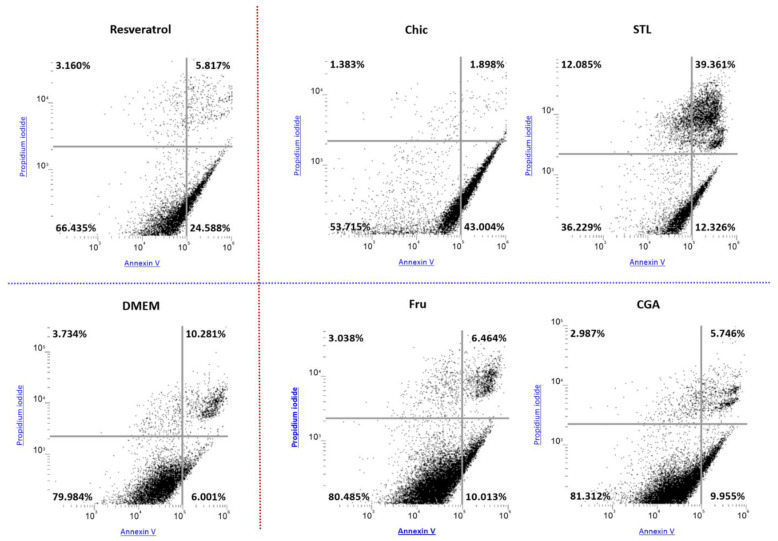
Figure 6.
Dot plots illustrating the apoptotic effect of chicory flour and its compounds on HepG2 cells. HepG2 cells were treated for 24 h with chicory decoction (Chic), fructose (Fru), CGA and STL solutions at different concentrations and analyzed using propidium iodide and Annexin V. Representations were selected among the most elevated concentration of each compound (3% for Chic and Fru; 100 µM for CGA and STL). Resveratrol at a concentration of 200 µM was used as a positive control, and DMEM as a negative one. The top left quadrant of each plot represents unviable cells, the top right quadrant represents necrotic cells or cells in late apoptosis. The bottom left quadrant represents viable cells and the bottom right quadrant represents early apoptotic cells. Total apoptotic cells were calculated by adding the top right and bottom right quadrant’s content. Samples illustrated in the top of the figure (Resveratrol, Chic and STL) provided an increased apoptotic effect compared to the other samples.

