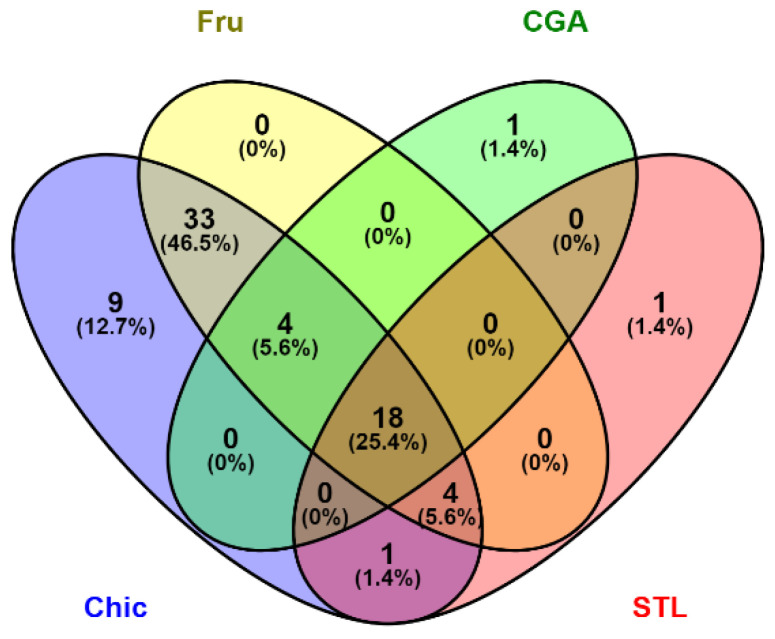
Figure 10.
Venn diagram illustrating an estimation of the most important effects of the chicory and its tested compounds: fructose (Fru), chlorogenic acids (CGA) and sesquiterpene lactones (STL). Number of DEGs was considered in transcriptome analysis, and number of modified taxa in metagenetic analysis. Results of hormone assay were constricted to significant modification as well as for in vitro analyses as significant response was considered 1 and a non-significant one was considered 0. A score was calculated by totaling these events for each diet. The Venn diagram’s platform (http://bioinfogp.cnb.csic.es/tools/venny/index.html accessed on 21 January 2022) was used to cross the data.

