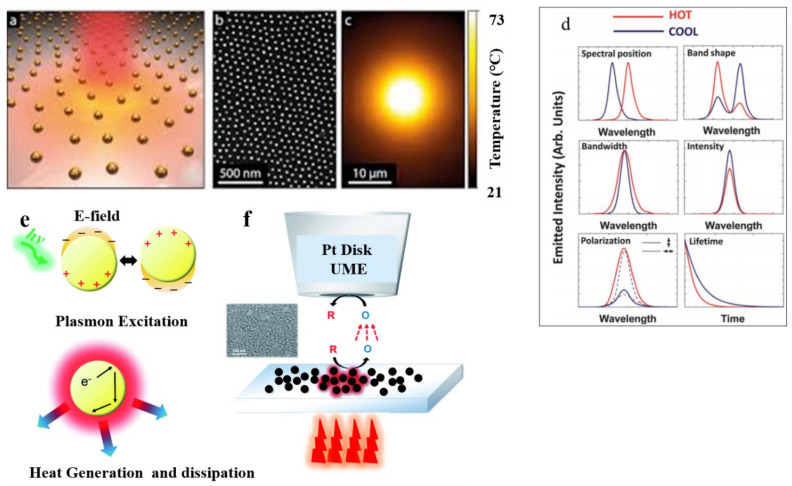
Figure 5.
(a) Representation of glass decorated with gold nanoparticles. (b) SEM analysis of gold nanoparticles. (c) Gold nanoparticles after illumination temperature profile [77]. Reprinted with permission from [77], Copyright 2018, EDP Sciences. (d) Possible effects due to temperature increase are schematically represented. Effects due to temperature increase are depicted as red lines. (e) Presentation of (top) excited surface plasmons and (bottom) the resulting plasmonic nanoparticle surface temperature increase. (f) SECM setup with Au nanoparticles on a substrate, schematically depicted with an SEM image [75]. Reprinted with permission from [75], 2018, The Royal Society of Chemistry.

