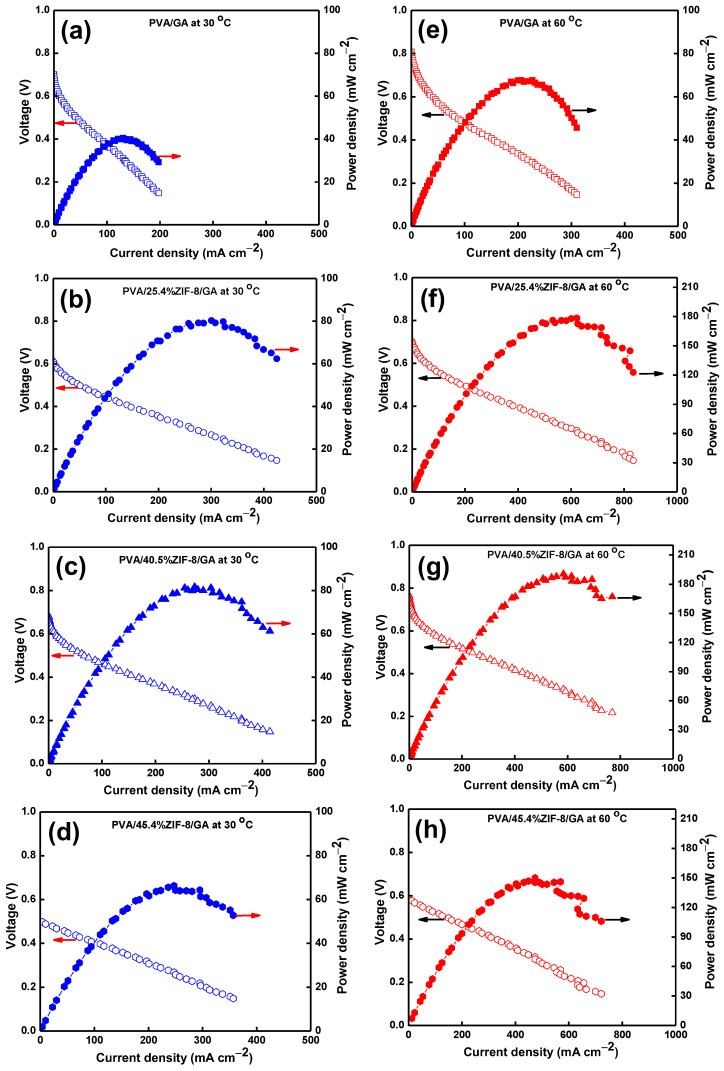
Figure 6.
Single-cell performance using PVA/GA, PVA/25.4%ZIF-8/GA, PVA/40.5%ZIF-8/GA, and PVA/45.4%ZIF-8/GA composite electrolytes: (a–d) cell voltage and power density at 30 °C, and (e–h) cell voltage and power density at 60 °C. The open symbols marked with left arrows show cell voltage data (value and unit in left Y axis) and the closed symbols with right arrows correspond to power density values (right Y axis).

