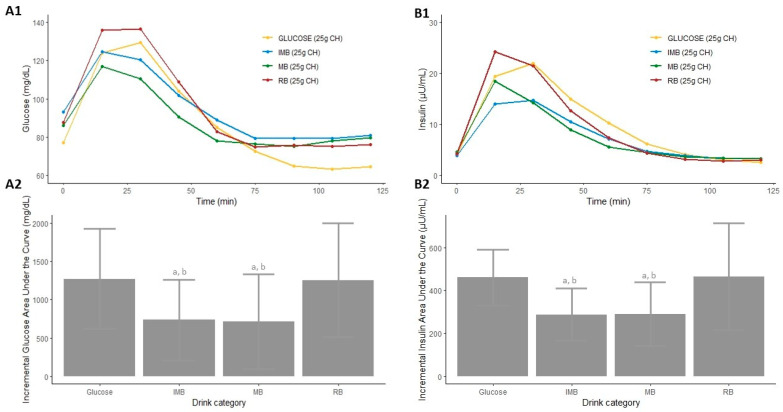
Figure 2.
Serum postprandial glucose concentrations (A1), insulin concentrations (B1), incremental glucose AUC (A2), and incremental insulin AUC (B2) after the consumption of each type of drink in Study 1. Differences in the incremental glucose and insulin AUC (A2,B2) after the consumption of each type of drink in Study 1 were determined with the use of a mixed-design ANOVA model. The Tukey–Kramer method was used for the post hoc analyses. a: p-value < 0.05 comparing the iAUC of IMB or MB vs. glucose. b: p-value < 0.05 comparing the iAUC of IMB or MB vs. RB. CH: carbohydrates; IMB: alcohol-free beer with almost complete fermentation of regular CH, enriched with isomaltulose (2.5 g/100 mL) and a resistant maltodextrin (0.8 g/100 mL); MB: alcohol-free beer with almost complete fermentation of regular CH, enriched with maltodextrin (2.0 g/100 mL); RB: regular alcohol-free beer.

