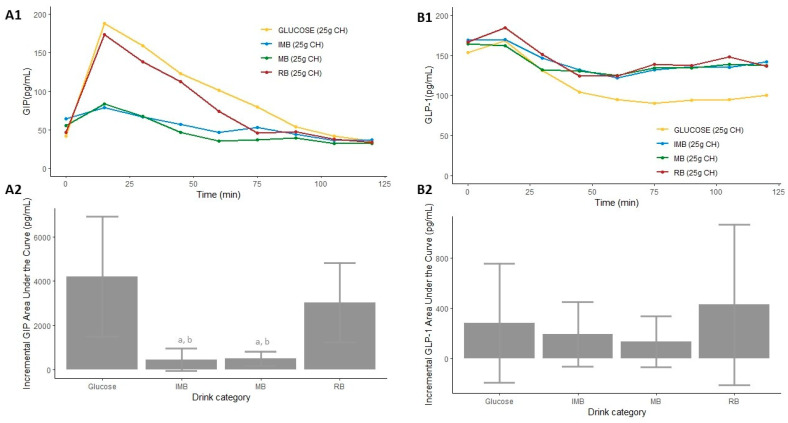
Figure 3.
Serum postprandial GIP concentrations (A1), GLP-1 concentrations (B1), incremental GIP AUC (A2), and incremental GLP-1 AUC (B2) after the consumption of each type of drink in Study 1. Differences in the incremental GIP and GLP-1 AUC (A2,B2) after the consumption of each type of drink in Study 1 were determined with the use of a mixed-design ANOVA model. The Tukey–Kramer method was used for the post hoc analyses. a: p-value < 0.05 comparing the iAUC of IMB or MB vs. glucose. b: p-value < 0.05 comparing the iAUC of IMB or MB vs. RB. CH: carbohydrates; IMB: alcohol-free beer with almost complete fermentation of regular CH, enriched with isomaltulose (2.5 g/100 mL) and a resistant maltodextrin (0.8 g/100 mL); MB: alcohol-free beer with almost complete fermentation of regular CH, enriched with maltodextrin (2.0 g/100 mL); RB: regular alcohol-free beer; GIP: gastric inhibitory polypeptide; GLP-1: glucagon-like peptide 1.

