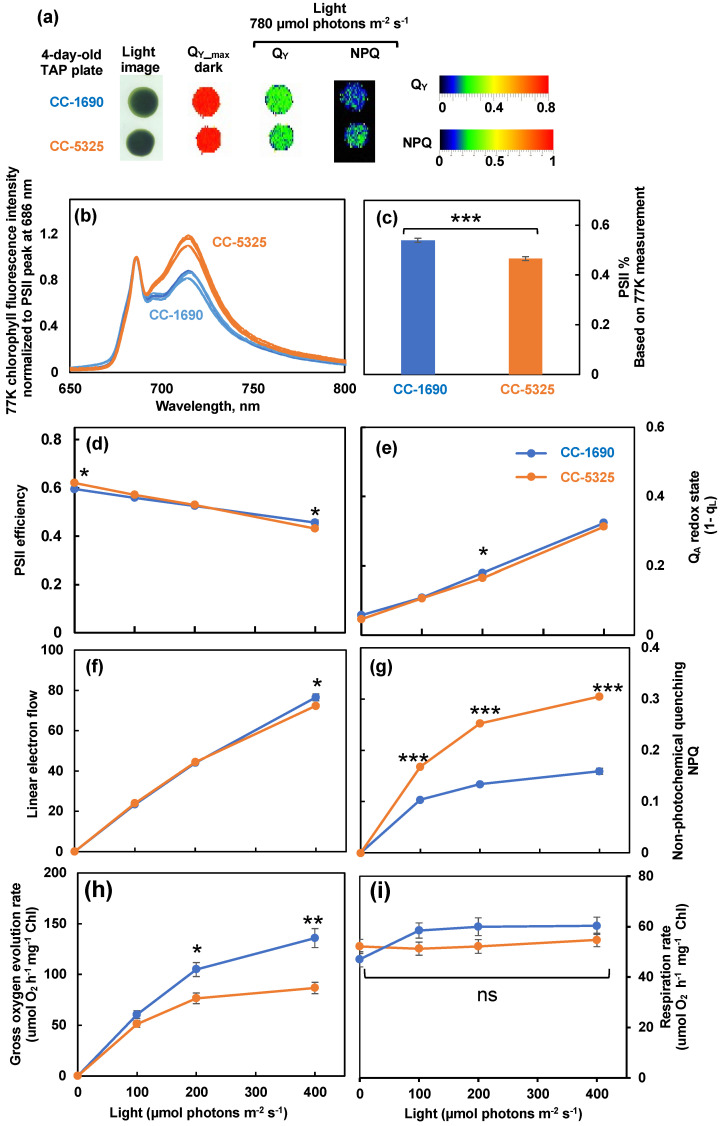
Figure 4.
CC-1690 had higher photosynthetic efficiency than CC-5325. (a) Chlorophyll fluorescence imaging of 4-day-old algal spots grown on TAP plates at 25 °C under 150 μmol photons m−2 s−1 white LED lights in incubators. Chlorophyll fluorescence imaging was performed by using FluorCam (Photo System Instruments). QY-max, maximum PSII efficiency in dark-adapted plates. Under 780 μmol photons m−2 s−1 light, QY and NPQ are PSII operating efficiency and non-photochemical quenching in light-adapted plates, respectively. Color bars represent values of QY and NPQ. (b–i) Algal liquid cultures grown in PBRs under the same condition as in Figure 2 were harvested for photosynthetic measurements. (b) 77 K chlorophyll fluorescence normalized to PSII peak at 686 nm. (c) PSII%, relative PSII antenna size, or light distributed to PSII, estimated from 77 K chlorophyll fluorescence data in (b). (d–g) Room temperature chlorophyll fluorescence measurements were performed in algal liquid cultures using a custom-designed spectrophotometer. See methods for details. (d) PSII efficiency, the data at 0 μmol photons m−2 s−1 light are the maximum PSII efficiency in dark and data from light phase are PSII operating efficiency in light-adapted cells. (e) QA redox state, the redox state of chloroplastic quinone A (QA), the primary electron acceptor downstream of PSII; the bigger number of QA redox state means more reduced QA. (f) Linear electron flow. (g) Non-photochemical quenching, NPQ. (h,i) Gross O2 evolution rates and respiration rates, measured using a Hansatech Chlorolab 2 Clark-type oxygen electrode. Mean ± SE, N = 3 biological replicates. (c–i). All figures have error bars, but some error bars may be too small to be visible on the graph. Statistical analyses were performed using a two-tailed t-test assuming unequal variance by comparing with CC-1690 under the same experimental conditions. *, 0.01 < p < 0.05; **, 0.001 < p <0.01; ***, p < 0.001; ns, not significant. (d–i) The positions of asterisks match the corresponding light intensities.

