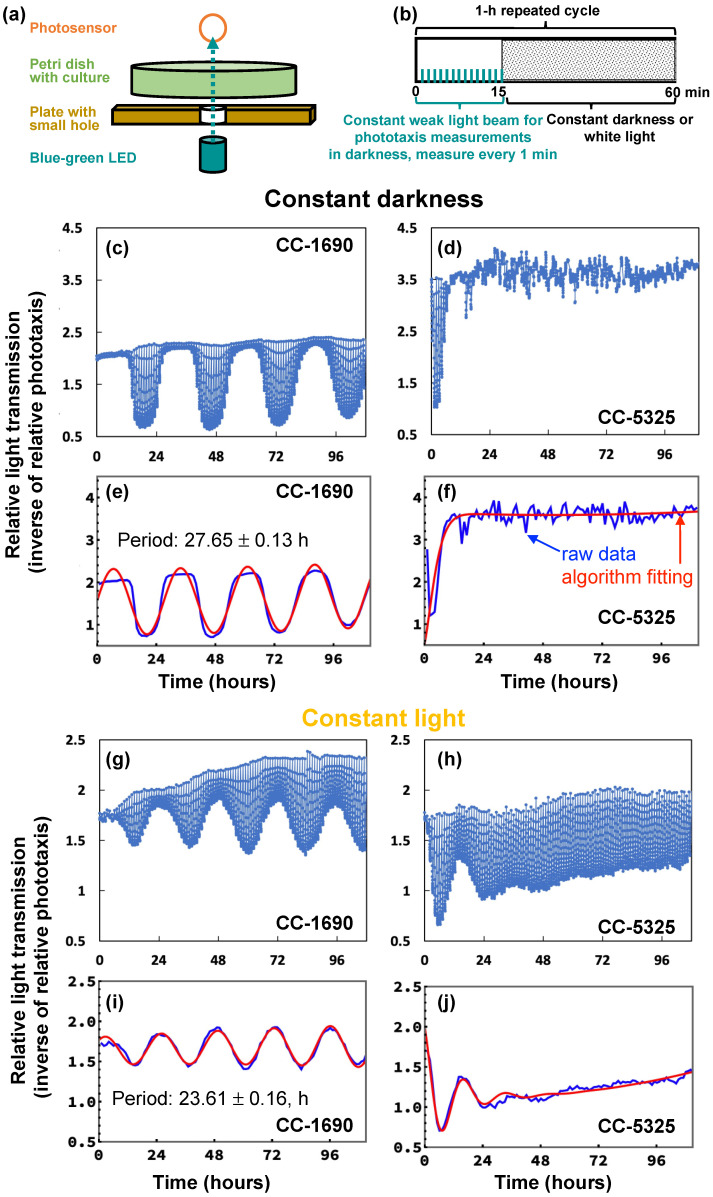
Figure 9.
In constant darkness or constant light, CC-1690 maintained a sustained circadian rhythm of phototaxis but CC-5325 could not. (a,b) Schematic drawing of how the phototaxis machine collected data. Repeated every hour (h), the consecutive blue-green light-emitting diode (LED) with a maximum wavelength of 507 nm shined a narrow, weak light beam through the culture for 15 min (min) and the light transmission was recorded every min by the photosensor. In the presence of the weak light beam, cells accumulated in the beam, reducing light transmission. The more phototactically active a culture is, the more cells accumulate in the beam and reduce the amount of light transmission. For the rest of the 45 min of a 1-h-cycle, cultures are exposed to either darkness, giving rise to “constant darkness” (c–f), or white background light, giving rise to “constant light” (g–j). Graphs on the left depict data for CC-1690 (c,e,g,i) and those on the right for CC-5325 (d,f,h,j). (c,d,g,h) Example graphs of the raw data collected by the phototaxis machine. Each vertical line in the graph shows the light transmission measurements the machine collected at 1-min intervals during a 15-min period with the weak light beam every 1-h cycle. If there was no or little phototaxis at a certain period of the 15-min weak light beam, data points for that period had no or little reduction of light transmission and appeared as very short vertical lines. (e,f,i,j) The raw data from the above graphs (blue line) were fed into an analysis algorithm leading to the best-fit sine wave (red line) the algorithm determined for the raw data. The analysis algorithm only used a single data point of a 15-min weak light beam period, which is the transmission measured after 11-min into the weak light beam (when good rhythms of phototaxis were clearly shown).

