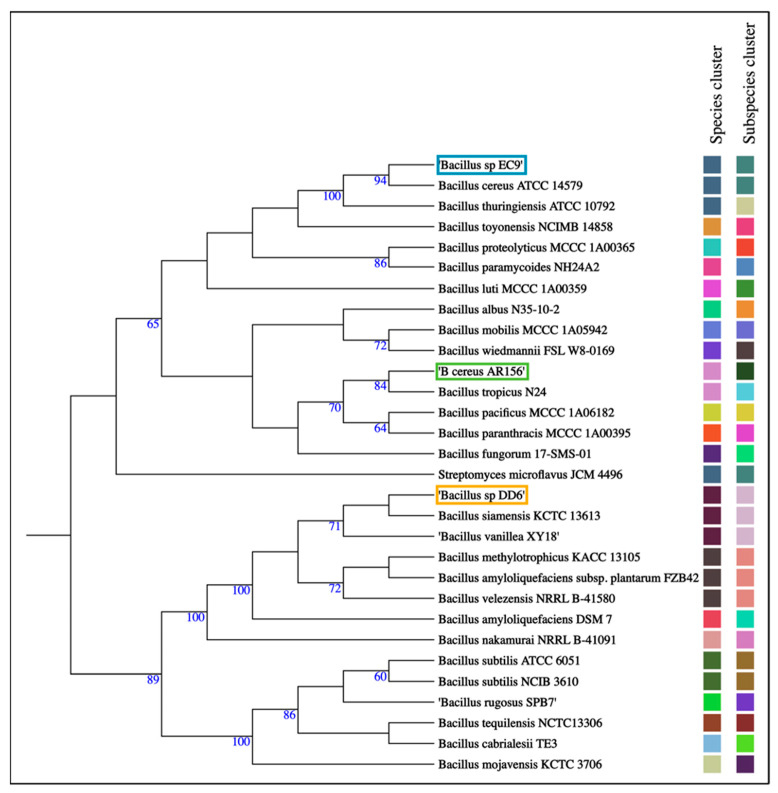
Figure 4.
Phylogenetic tree showing grouping of bacterial strains DD6 and EC9, marked in orange and blue boxes, respectively, into species and subspecies clusters. The reference strain B. cereus AR156 is marked in a green box. Whole-genome sequences of the strains were analysed by pairwise comparison against a set of best-matching type-strains genome sequences using the Type (Strain) Genome Server (TYGS). Matching square colours indicate same species and subspecies clusters. The tree was inferred according to [35]. The numbers indicate Genome Blast Distance Phylogeny (GBDP) pseudo-bootstrap support values >60% from 100 replications.

