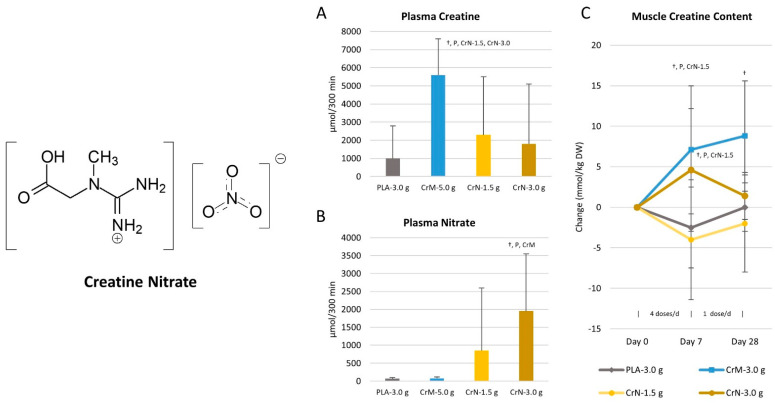
Figure 12.
Chemical structure of creatine nitrate. (A,B) show 5 h area under the curve data after plasma creatine and plasma nitrate, respectively. (C) shows mean changes in muscle creatine content with 95% confidence intervals after 7 days of loading 4 doses/day and 21 days of ingesting 1 those/day. † Represents significant change from baseline, PLA and P represent placebo, CrM represents creatine monohydrate, and CrN represents creatine nitrate.

