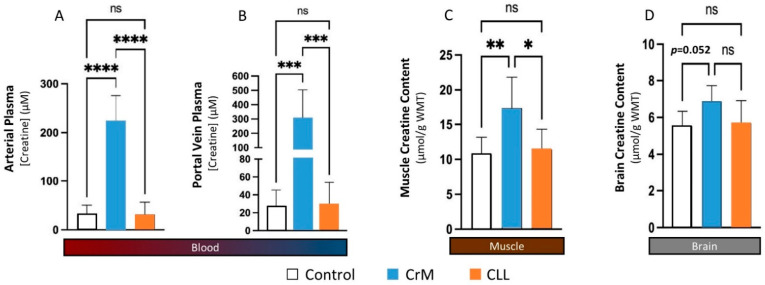
Figure 16.
Blood, muscle, and brain creatine content in response to rats fed a control diet, 4.0 g/kg/day of creatine monohydrate (CrM), or 6.56 g/kg/day of creatyl-L-Leucine (CLL) for 7 days. (A) presents arterial plasma creatine concentration, (B) presents portal vein creatine concentration, (C) presents muscle creatine content, and (D) presents brain creatine content data for each group. Data are means ± standard deviations. **** = p < 0.0001, *** = p < 0.001, ** = p < 0.01, * p < 0.05, ns = not statistically significant between groups identified in brackets. Adapted from da Silva [221].

