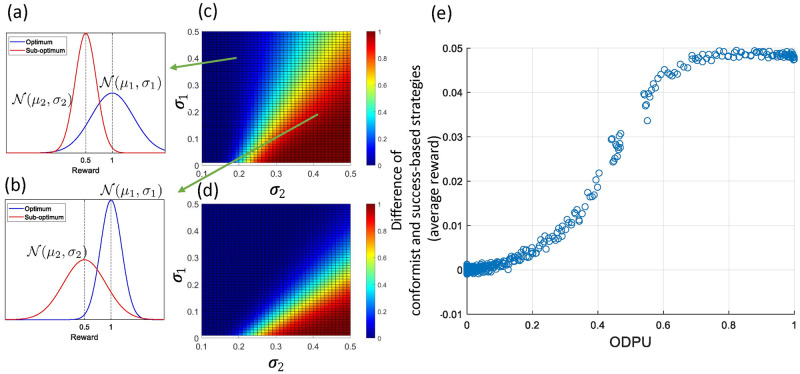
Fig 3. The higher the uncertainty between two distributions (measured by the ODPU) the higher the performance difference between conformist and success-based strategies in terms of average population reward at the end of simulation processes.
(a) and (b) illustrate two cases where σ1 = 0.4, σ2 = 0.2 and σ1 = 0.2, σ2 = 0.4 respectively. (c) and (d) show the ODPU, formalized as the probability of sampling the highest reward value from the sub-optimum distribution, depending on σ1 and σ2 and the ratios of samples drawn independently from the optimum and sub-optimum reward distributions. In (c) the ratios of samples drawn from the optimum and sub-optimum distributions are 0.05 and 0.95, and in (d) the ratios are 0.5 and 0.5 respectively. (e) shows the relation between the ODPU and the difference in average reward at the end of the process between the populations with conformist and success-based strategies.

