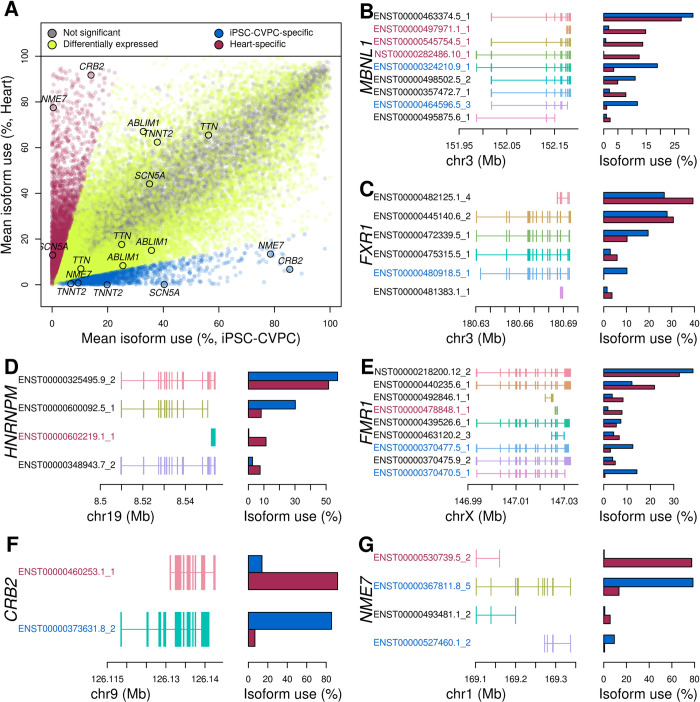
Fig 2. Large-scale isoform switching occurs between fetal-like iPSC-CVPC and heart tissue.
(A) Scatter plot showing differential usage between adult heart and iPSC-CVPC for all expressed isoforms. iPSC-CVPC- and adult heart-specific isoforms are shown in blue and purple, respectively (absolute value of the log2 ratio between mean isoform use between iPSC-CVPC and adult heart > 2 and FDR < 0.05). All other differentially expressed isoforms are shown in yellow (FDR < 0.05). Isoforms not differentially expressed are shown in gray. Isoform switching occurs between fetal-like iPSC-CVPC and adult heart for four RBPs (B-E) and two genes (F-G) with known cardiac functions. Left side of the figure represents the exon structure of each expressed isoform; the barplots on the right show the mean isoform use (%) of each isoform in iPSC-CVPC (blue) and adult heart (purple). Isoform IDs highlighted in blue are iPSC-CVPC-specific and isoform IDs highlighted in purple are adult heart-specific.

