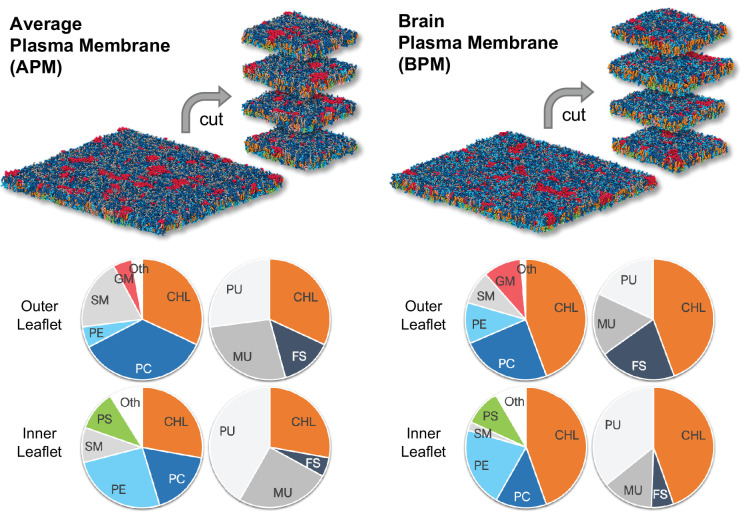
Figure 1. The average mammalian and human brain plasma membranes.
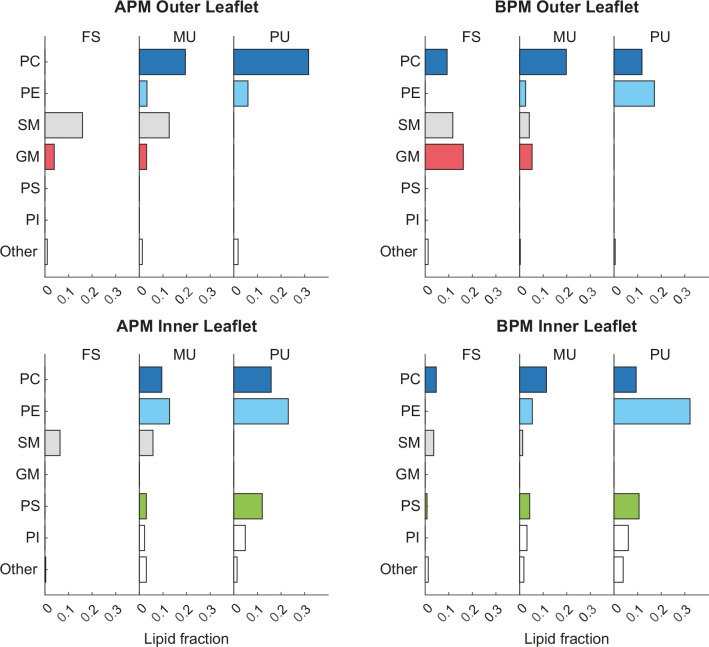
Two equilibrated membranes taken from the study of Ingólfsson et al., 2017 were cut into four 30 nm x 30 nm large pieces each. The pie charts show the fraction of lipid subgroups in the inner and outer leaflets of the membranes. CHL, cholesterol; PC, phosphatidylcholine; PE, phosphatidylethanolamine; SM, sphingomyelin; GM, gangliosides; PS, phosphatidylserine; FS, fully saturated lipids; MU, monounsaturated lipids; PU, polyunsaturated lipids. Figure inspired by Ingólfsson et al., 2017.


