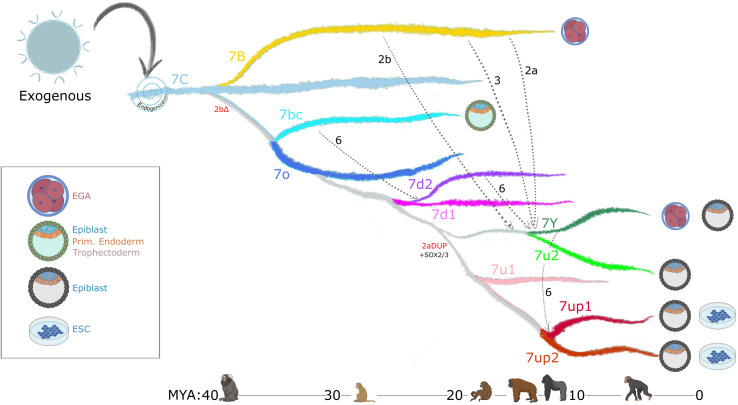
Figure 7. Model of LTR7 subfamily evolution.
Estimated LTR7 subfamily transpositional activity in million years ago (mya) is listed with corresponding approximate primate divergence times (bottom). The positioning and duration of transpositional activity are based on analysis from Figure 3B. The gray connections between subfamilies indicate average tree topology which is driven by overall pairwise sequence similarity. Dashed lines indicate likely recombination events which led to the founding of new subfamilies. Stage-specific expression profiles from Figure 5A are detailed to the right of each corresponding branch.

