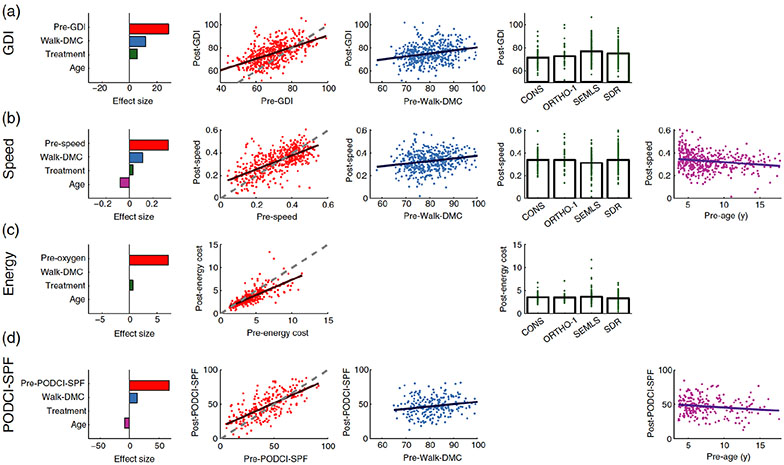
Figure 1.
For each outcome measure (row) the effect sizes and adjusted responses are shown for statistically significant predictors (columns). Plots are only shown for variables that had a significant relationship in the regression model (see Table II). All measures are dimensionless, except for age (years). Energy cost is expressed as a multiple of energy cost for a speed-matched control (×SMC). The dashed line in the post- vs. pre-treatment plots represents no change. Post-treatment levels above this line are improvement, and below the line are worsening, except for energy cost where below the line represents improvement. For each outcome domain, pre-treatment levels closer to those of typically-developing individuals lead to smaller improvements (or worsening) after treatment. We have described this response as “diminishing returns”. In contrast, higher Walk-DMC values, reflecting control more like that of typically developing individuals, lead to larger postoperative improvements, or “increasing returns”. The pre-treatment level of the outcome variable had the largest effect size across all outcomes. Walk-DMC had the next largest effect size – larger than treatment choice or age - except in the case of energy cost, where Walk-DMC was not a significant predictor. It is also noteworthy that the effect size of treatment choice is consistently small, and in the case of the PODCI-SPF, not statistically significant.

