
Figure 2.
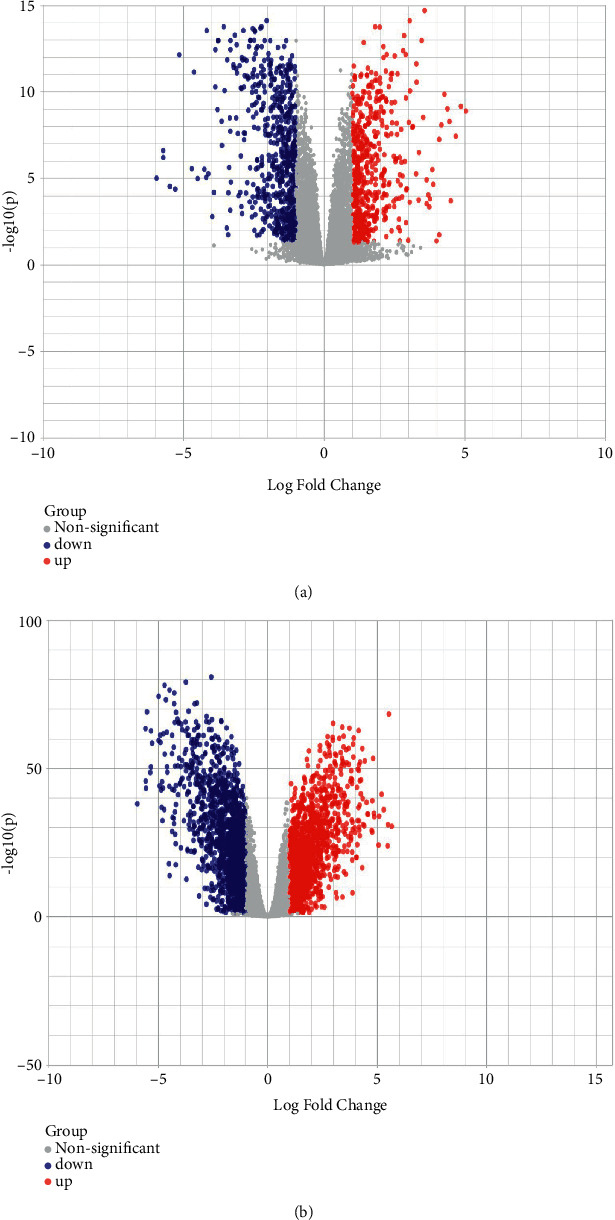
Volcano plots: GPL4133 (a) and GPL13607 (b) expressions of the upregulated genes and downregulated genes. Upregulated genes are shown in red color, downregulated genes are shown in blue, and nonsignificant genes are shown in black with a log2 fold-change of 1.0 and an adjusted p value of 0.005.