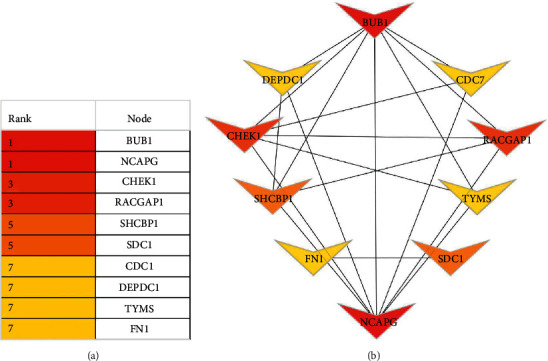
Figure 6.

Cytoscape software was used to retrieve the top hub genes. The node color gives an idea for the connection degree. The major ten hub genes show the color change from red to yellow. The red color represents the highest degree node, the light orange represents the intermediate one, and the yellow color reflects the lowest degree node among the top 10 hub genes.
