
Figure 4.
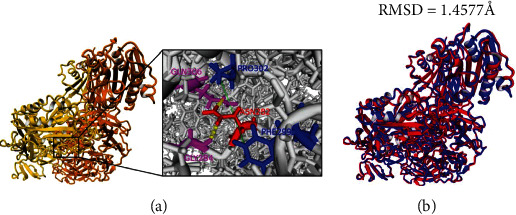
Bioinformatics analysis of the structural impact of the in-frame deletion on the integrin beta-2 and integrin alpha-X (CD11c) protein complexes. (a) Interaction analysis between Asn282 and neighboring amino acids. Integrin beta-2 protein is highlighted in yellow, and integrin alpha-X is highlighted in orange. Residues involved in hydrogen bonds are shown in magenta, and residues involved in hydrophobic interactions are shown in blue. Green lines between amino acids represent hydrophobic interactions, and yellow-dotted lines represent hydrogen bonds. (b) Superimposition of wild-type (blue) and mutated (red) complexes.