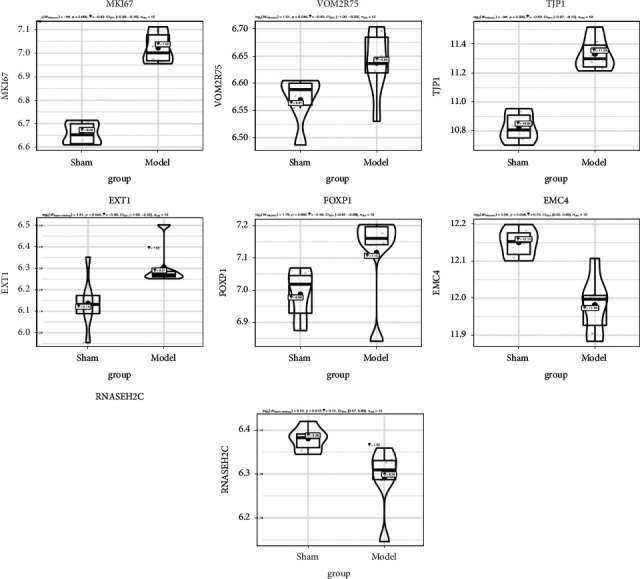
Figure 5.

The selection and verification of the candidate hub genes. The expression of MKI67, VOM2R75, TJP1, EXT1, FOXP1, EMC4, and RNASEH2C differed between the two groups. The genes with the highest connectivity were screened out by WGCNA. To validate the expression data of these genes, the GSE63442 and GSE30691 datasets were selected for pairwise validation by independent t-test. The ggstatsplot package was used to perform t-test and plot graphs. GEO, Gene Expression Omnibus. Statistical analysis was conducted using the independent t-test. Plots represented mean ± 95% confidence interval (CI).
