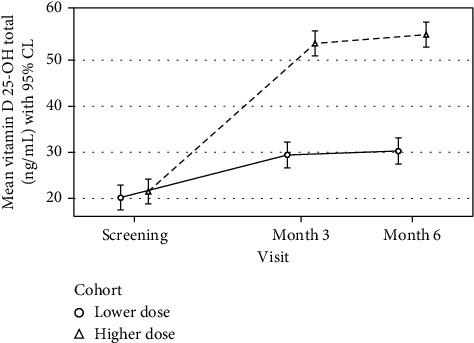
Figure 3.

Mean serum vitamin D (25 OH D) by treatment allocation and time. The mean change in the vitamin D level as a function of elapsed time since baseline, treatment assignment, and their interaction from a linear mixed-effects model based on 129 participants contributing 370 vitamin D laboratory measurements.
