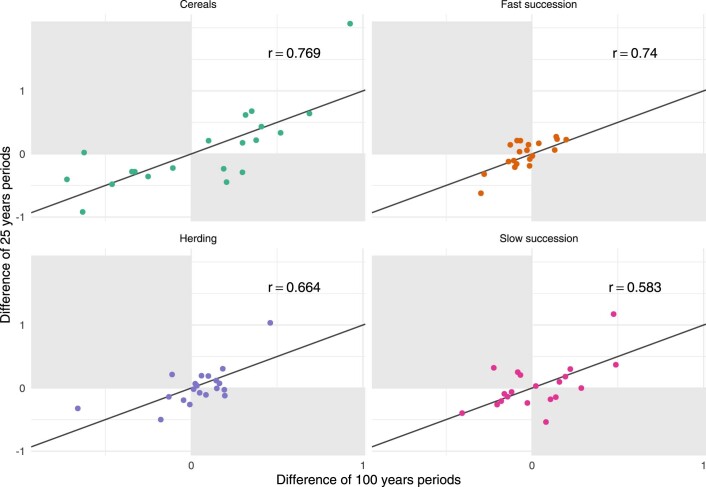
Extended Data Fig. 5. Differences and similarities in the changes in the BDP pollen indicators between 100-yr and 25-yr periods of analysis.
Points displayed in white areas represent regions where the direction of changes was the same over the longer versus shorter periods of time. Points displayed in grey areas represent regions where the direction of changes was different over the longer versus shorter periods of time. Based on Supplementary Fig. 2.

