
Fig. 1. Loss of NFE2L3 leads to a decrease in tumor burden and inflammation.
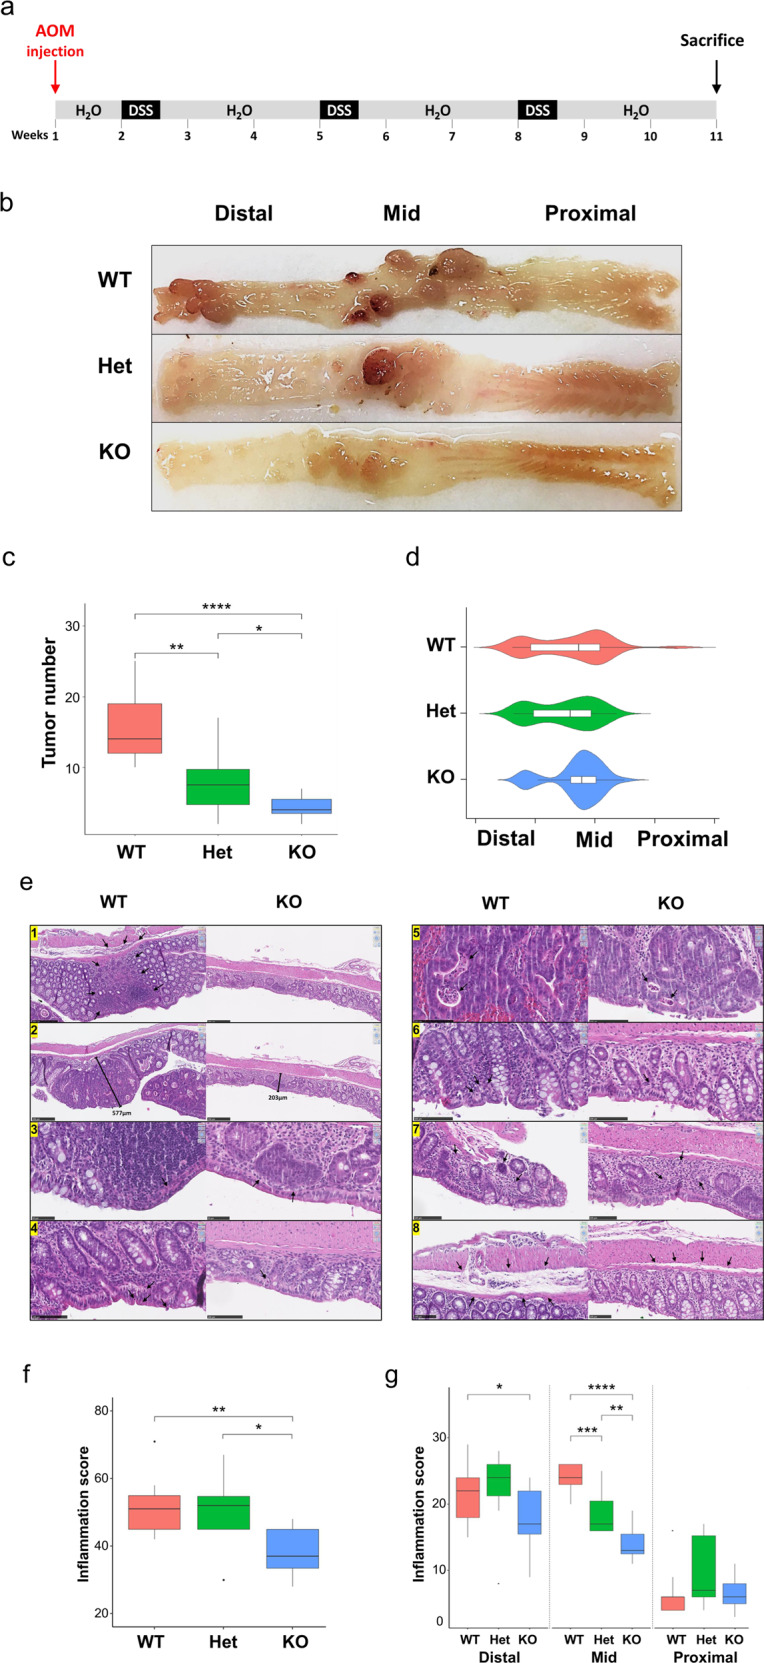
a AOM was injected at day 1 at 7 mg/kg. Starting at day 8, three repeated treatments of 2.5% DSS were given with 4 days of DSS administration followed by 17 days of water. Mice were sacrificed at day 70 and 71. b Schematic depicting the digestive track and the different segments of the colon along with representative pictures of AOM/DSS mouse colons opened longitudinally from littermates with the genotypes Nfe2l3+/+ (WT), Nfe2l3+/− (Het) and Nfe2l3−/− (KO). c Boxplot representation of tumor number distribution per genotype. Tumors were counted from wild type, heterozygous and knockout mice (n = 9–12). d Violin plot with imbedded boxplot representation of tumor distribution pattern. Colon length was normalized from 0 to 100 and sections were split into three equal parts distal (0–33.3), mid (33.4–66.6) and proximal (66.7–100) colon. e Hematoxylin/Eosin stained sagittal sections of wild type and knockout colons. Criteria observed are inflammatory cell infiltration and cell depth (1), mucosal thickening (2), surface epithelial degeneration (3), gland epithelial apoptosis (4), gland degeneration/abscesses (5), goblet/enterocyte ratio decrease (6), gland loss (7), and submucosal edema (8). Boxplot representation of total colon inflammation per genotype in full length (f), or distal, mid, and proximal sections (g), scored from 0 to 4 using the above criteria. Data represent unpaired t-test c–g; unpaired t-test; *p ≤ 0.05; **p ≤ 0.01; ***p ≤ 0.001 and ****p ≤ 0.0001. Black dots represent outliers.