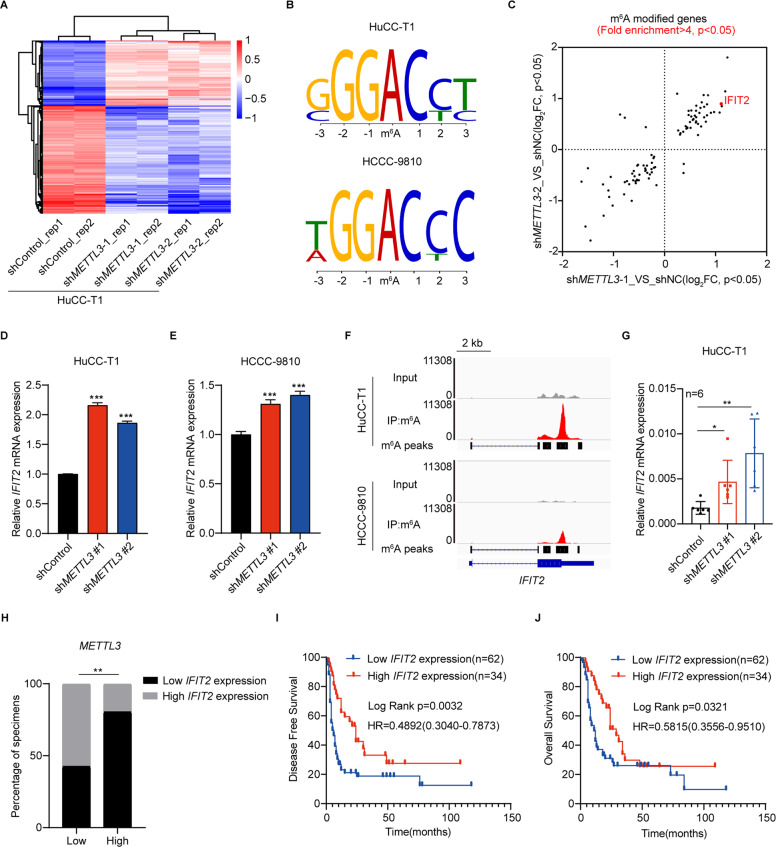
Fig. 5. IFIT2 is the downstream target of METTL3.
A Heatmap showing the expression changes of METTL3-KD and Control HuCC-T1 cell. B The m6A consensus sequence motifs in HuCC-T1 and HCCC-9810 cells was identified. C Scatter plot shows the genes with m6A modification (fold enrichment >4 and P < 0.05) in both HuCC-T1 and HCCC-9810 cells and differentially expressed (Log2foldchange > 0.5 and P < 0.05) in HuCC-T1 cells after METTL3 silencing. D Relative expression of IFIT2 in METTL3-KD and Control HuCC-T1 cells. E RT-qPCR analysis of IFIT2 after METTL3 silencing in HCCC-9810 cells. F Integrative genomics viewer (IGV) plots indicates m6A peaks at IFIT2 mRNAs in MeRIP-seq of ICC cells. The y axis shows the sequence read number, and the blue boxes represent protein-coding exons. G RT-qPCR analysis of IFIT2 mRNA expression in HuCC-T1 xenograft models after METTL3 knockdown or not. H Bar graphs indicate the correlation of METTL3 expression with IFIT2 expression in ICC specimens. I Kaplan–Meier survival curves of DFS in 96 patients with ICC. (IFIT2 low expression, n = 62 vs. IFIT2 high expression, n = 34). The P value was calculated using the log-rank test. HR hazard ratio. J Kaplan–Meier survival curves of OS in 96 patients with ICC. (IFIT2 low expression, n = 62 vs. IFIT2 high expression, n = 34). The P value was calculated using the log-rank test. HR hazard ratio. The results are presented as mean ± SD of three independent experiments. *P < 0.05, **P < 0.01, ***P < 0.001, according to Student’s t test.

