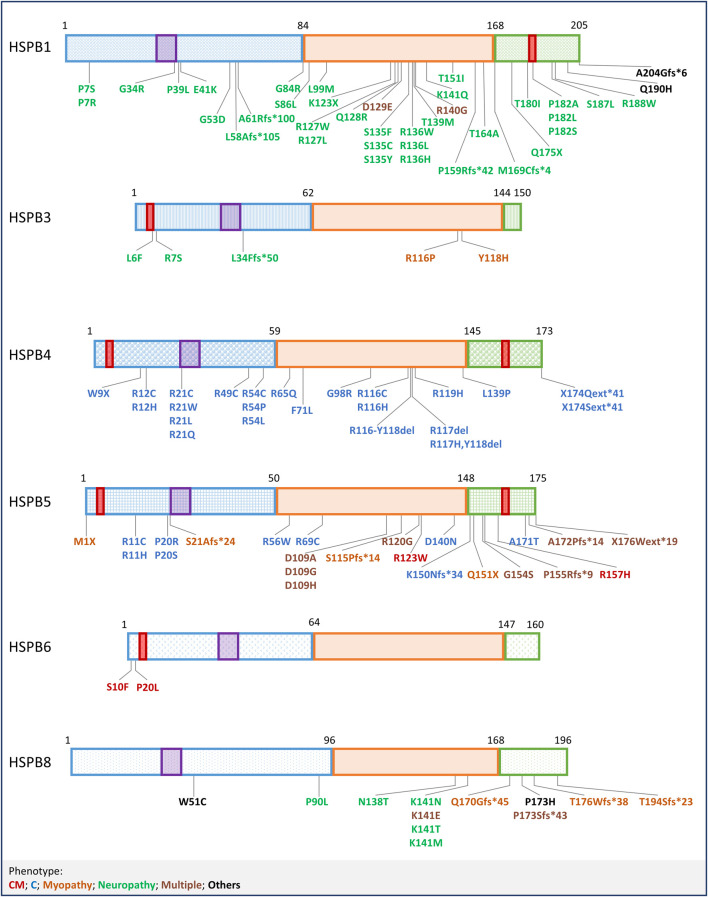
FIGURE 3.
Mutations in HSPBs. Graphical representation of HSPBs structure and mutations, based on Figure 1. Mutations are labelled with colors corresponding to the phenotypes reported at the bottom. CM = Cardiomyopathy, C=Cataract; Multiple (phenotypes) refers to mutations that have been linked to more than one phenotype, in combination or not; Others refer to mutations not included in the list.

