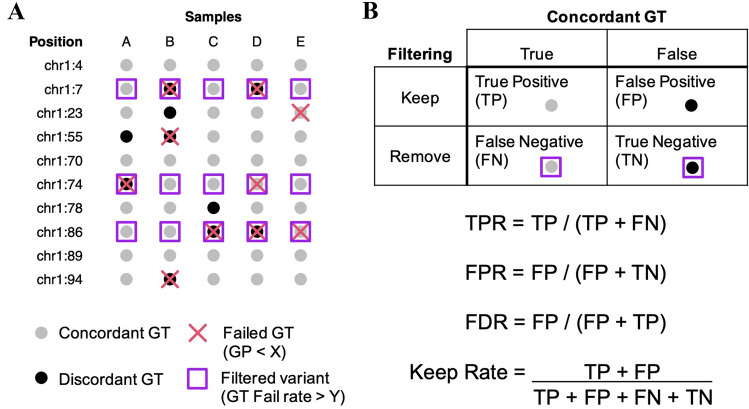
Fig. 3.
Filtering strategies for reducing imputation errors. a Schematic of imputed genotypes. Genotypes are represented as filled in circles, where black circles indicate discordant genotypes and gray circles indicate concordant genotypes. In this example, the genotypes themselves, such as heterozygous and homozygous, are hidden as they are not relevant. Generally, genotype concordance between actual and imputed data remains unknown and other alternative metrics are used to filter out sites that likely contain an abundance of imputation errors. Here, max genotyping probability (GP) is used to assess genotyping confidence. GP below a certain threshold, X, identifies low-confidence genotypes, which are marked with a red cross. Genomic positions that contain greater than a certain number of low-confidence genotypes are filtered out as their low-confidence genotyping rate is above the threshold Y. Here, sites with a low-confidence genotyping rate > 20%, or 1 out of 5 samples, are marked with purple squares. Ideally, sites removed by filtering are enriched for discordant genotypes. b The statistics are used to assess and compare filtering strategies. These include, true-positive rare (TPR), false-positive rate (FPR), false discovery rate (FDR), and keep rate, which is measured as the proportion of genotypes remaining after filtering

