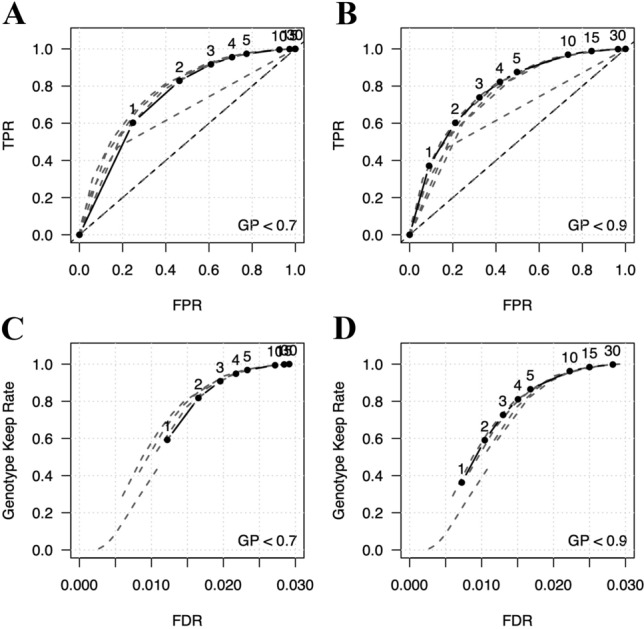
Fig. 4.

Performance of filtering strategies for reducing imputation errors. a ROC curve, where genotypes with GP < 0.7 are identified as low confidence (solid line). Numbers above each point along the solid line represent low-confidence rate thresholds for removing sites. These values and their ordering are identical across all four panels. Sites with a total number of low-confidence genotypes greater than or equal to the threshold are removed. Gray dashed lines represent ROC curves for other confidence threshold values. b ROC curve for confidence threshold set at GP < 0.9. c The proportion of variants remaining after filtering genotypes at GP < 0.7 and the corresponding FDR. As in C, the numbers above each point represent low-confidence rate threshold values and gray dashed lines represent curves for other confidence thresholds. d Proportion of variants remaining and their corresponding FDR after filtering at GP < 0.9
