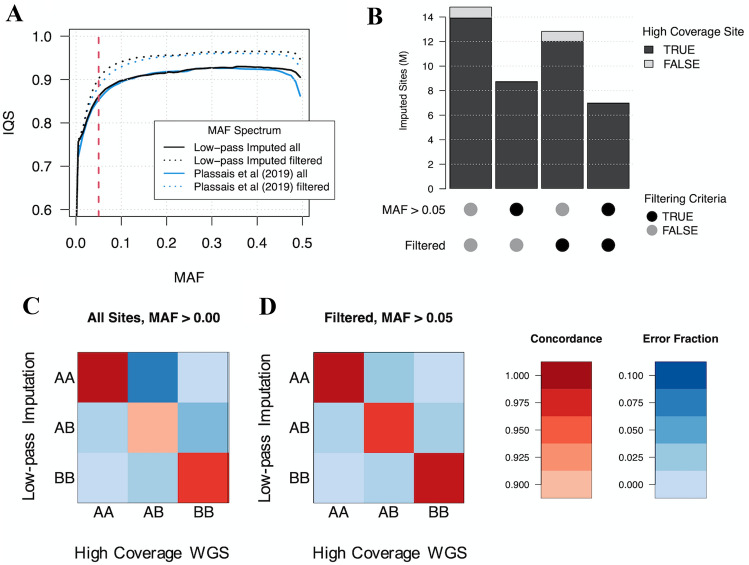
Fig. 5.
Imputation accuracy according to minor allele frequency and genotype. a Imputation accuracy according to imputed and Plassais et al. (2019) MAFs for all sites and quality-filtered sites. Imputation accuracy is measured as mean imputation quality score (IQS), an imputation accuracy statistic that accounts for the probability an allele is correctly imputed by chance. The red dotted line indicates a MAF of 0.05. b The number of sites remaining after filtering for MAF > 0.05 and for low-confidence genotypes < 5% as indicated by the “Filtered” label. Bar colors represent imputed sites that were either found or missing from the high-coverage WGS dataset. c Concordance and error rates for all genotypes, expressed as a fraction of the total number of high-coverage WGS genotypes. d Concordance and error rates for genotypes in sites with < 5% low-confidence genotypes and MAFs > 0.05. Rates are expressed as a fraction of the number of high-coverage WGS genotypes that meet the corresponding filtering criteria

