Fig. 7.
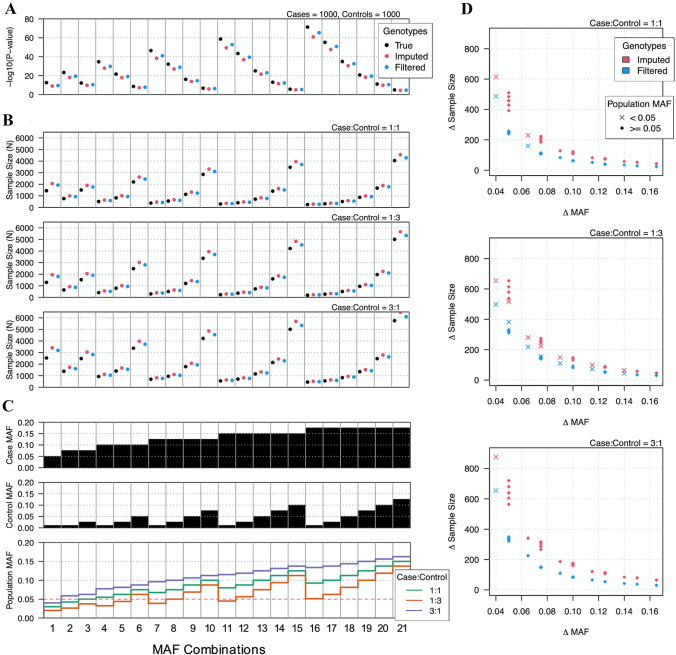
Impact of imputation errors on case–control GWAS. a Significance of case–control GWAS at multiple MAFs. True genotypes are represented by black circles, where the frequency of heterozygous and homozygous variants follow Hardy–Weinberg equilibrium. Red circles represent the outcomes of significance testing on imputed genotypes, while blue circles represent outcomes after filtering imputed genotypes. Note, decreases in significance were due to estimates of errors introduced during the process of imputation. Imputation errors were modeled according to the probability of a given genotype being imputed as any other genotype at any stated MAF. b Power analysis of significance testing for case–control GWAS of true and imputed genotypes. Y axis shows required samples size to reach a statistical power of 0.80. Each individual plot shows different case–control ratios. Power was calculated for a 2 × 2 chi-square test for significance level 5 × 10⁻⁸, where effect size was calculated as Cohen’s w. c Case and control MAFs used for each significance test analysis and the combined population allele frequency for each case and control configuration. Panels (a–c) are arranged in columns so that results presented in a and b correspond to the MAF configurations and values displayed in (c). d Additional samples required to reach sufficient power for imputed genotypes. Delta sample size is the difference between required sample sizes for true genotypes and imputed or quality-filtered imputed genotypes. Delta MAF is the difference in MAFs between cases and controls. Delta MAF is proportional to effect size

