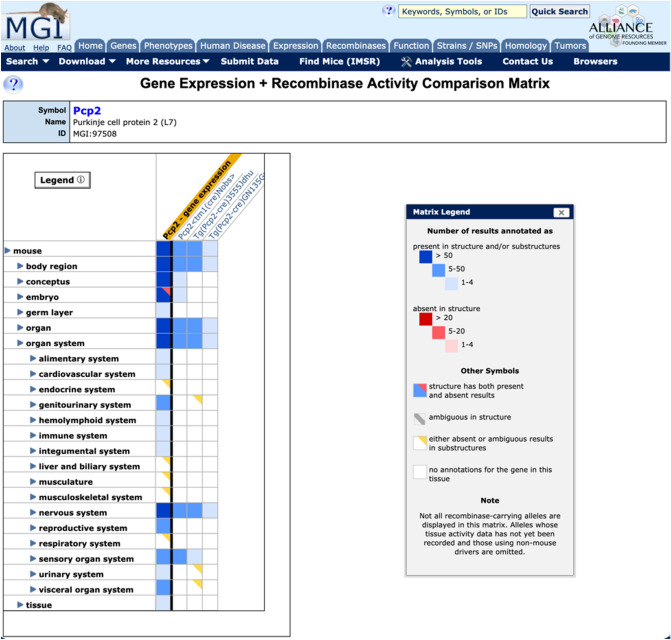
Fig. 5.
Matrix view of Cre activity from Pcp2 driver lines compared to endogenous gene expression. Shown are the activity assay data for three recombinase-expressing lines utilizing the mouse Pcp2 promoter compared to endogenous Pcp2 gene expression. The EMAPA mouse anatomy ontology is shown on the left and the toggles can be opened and closed to view more substructures for a given system. The red square indicates that activity was specifically assayed in a system but not detected

