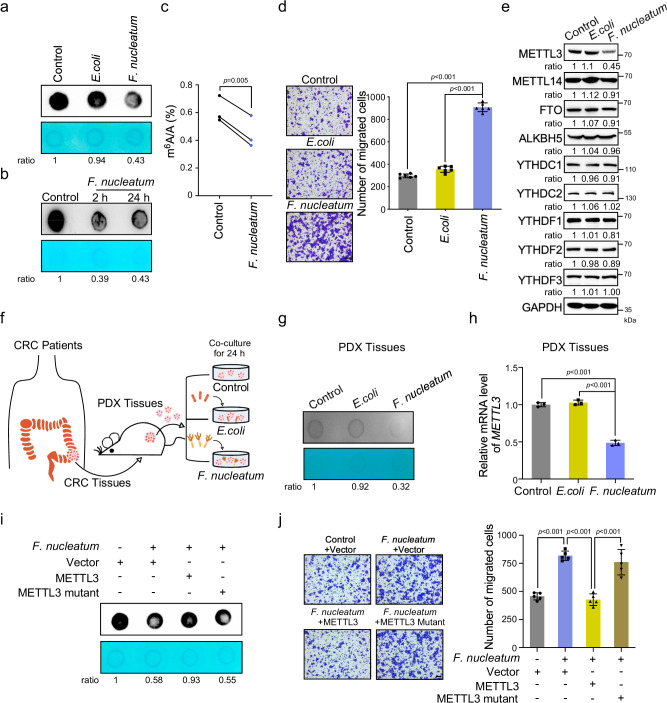
Fig. 1. F. nucleatum reduces METTL3-mediated m6A modifications in human CRC cells and PDX tissues.
a mRNA dot blot analysis was performed to determine the m6A levels of HCT116 cells treated with F. nucleatum, E.coli DH5α, or PBS control for 24 h. b mRNA dot blot analysis was performed to determine the m6A levels of HCT116 cells treated with F. nucleatum for 2 or 24 h. c UHPLC Q-Exactive MS analysis was performed to determine the m6A/A ratio of the total mRNA in HCT116 cells treated with F. nucleatum or PBS control for 24 h. d HCT116 cells were pretreated with F. nucleatum, E.coli DH5α, or PBS control for 2 h and subjected to transwell assay (Left). The migrated cell were quantified by counting in six fields (Right). Scale bar, 100 μm. e Western blot was performed to determine the m6A modification-associated protein levels in HCT116 cells with indicated treatment. f Schematic illustration of the PDX model established with tumor tissues from CRC patients. The ex vivo model of PDX tissues treated with F. nucleatum, E.coli DH5α, or PBS control was shown. g, h The PDX tissues treated with F. nucleatum, E.coli DH5α, or PBS control for 24 h were subjected to mRNA dot blot analysis of m6A levels (g). Quantitative RT-PCR analysis was performed to detect the expression of METTL3 in PDX tissues (h). i The HCT116 cells were transfected with wild-type METTL3, or catalytic mutant (aa395–398, DPPW-APPA) METTL3, or control pcDNA3.1(+) plasmids and treated with F. nucleatum or PBS. mRNA dot blot analysis of m6A levels were performed. j The HCT116 cells with indicated treatments were applied for transwell migration analysis. Representative images of migrated cells were shown (Left). The migrated cells were quantified in five fields (Right). Scale bar, 100 μm. The methylene blue staining was used as a loading control in the mRNA dot blot assay. Data were from one representative of three independent experiments (a, b, e, g, i). Data were shown as mean ± SD. P values were shown. A two-tailed paired t-test (c), two-tailed Student’s t-test (d, h, j).

