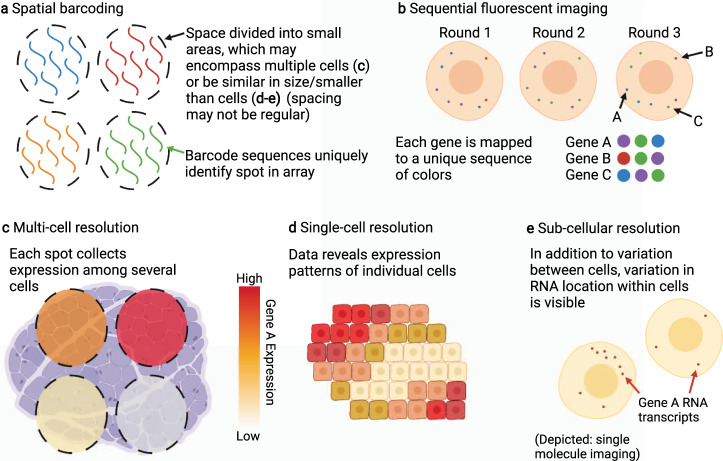
Fig. 1. Spatial Transcriptomics Data: Collection and Resolutions.
ST data can be collected with various methods and resolutions. a Illustration of spatial barcoding, in which spatially-identified barcodes are arranged and then used to tag RNA molecules in tissue. Compare with c, but note these methods are not restricted to multi-cell resolution. b Illustration of sequential fluorescent imaging, where RNA molecules are sequentially tagged with different color fluorescent probes and the color sequences are used to identify RNA species. In general, this data is collected at sub-cellular resolution, as show in e, but is frequently combined with cell segmentation to create single-cell data, as in d. c Multi-cell resolution spots, in which measured expression at one spatial location is collected across a number of possibly heterogeneous cells. d In single-cell resolution data, each spatial location corresponds to one cell. This allows for spatial analysis of cell identity and a single-cell understanding of tissue structure and cell-cell communications. e One type of sub-cellular resolution data is single-molecule imaging. Note the presence of information both in the number of distinct RNA molecules of one type in a cell, and also the localization of those molecules within the cell. Sub-cellular resolution data may be combined with cell segmentation to produce single-cell data to facilitate corresponding analysis.

