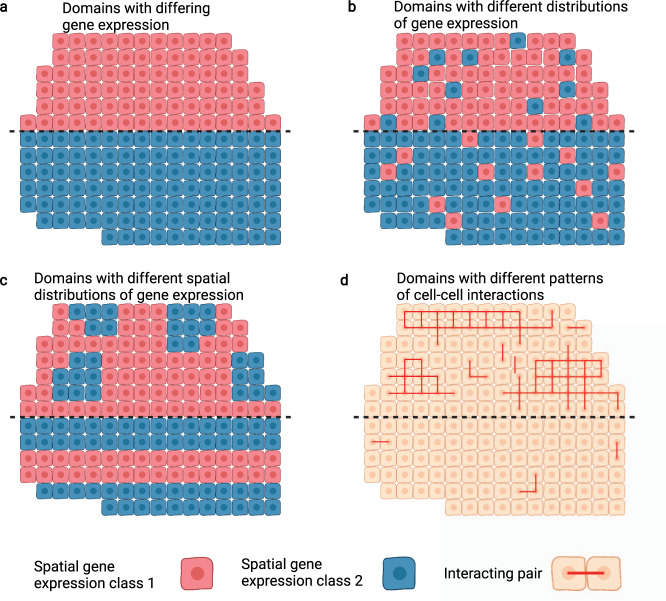
Fig. 2. Illustration of different traits that can separate spatial regions.
a–d Dotted line indicates division between two regions. Red and blue cells indicate groups with consistent expression across some set of spatially variable genes. a Regions are characterized by different gene expression, equivalent to the groups identified by cluster analysis such as the Louvain algorithm on non-spatial data. b Regions are not entirely homogeneous, but instead differ in distribution of observed expression. c Regions have similar distributions, but differ in the spatial patterning of gene expression. d Red lines connect interacting cells. Beyond cell type indicated by gene expression, regions may be distinguished by higher-level properties such as patterns of cell-cell interactions. Performing region identification downstream of other analyses could allow for detecting variance in such properties.

