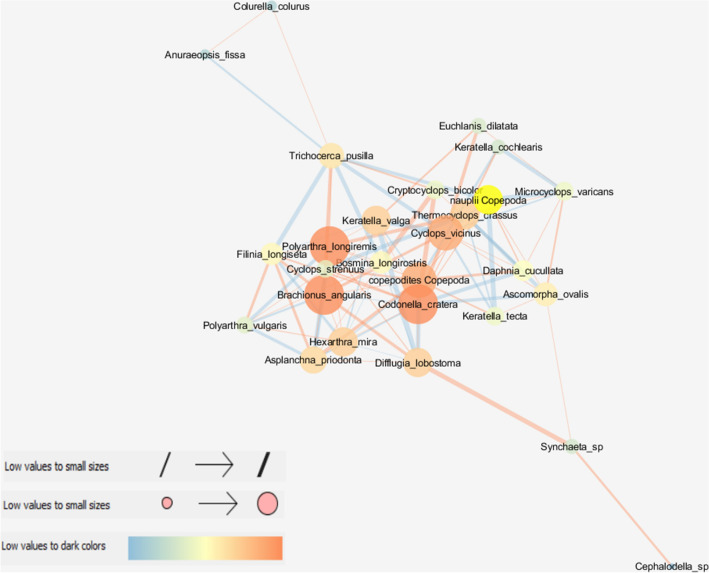
Figure 1.
Network graph analysis of the interactions between zooplankton species in the HT class with node closeness centrality (NCC), node betweenness centrality (NBC) and edge betweenness centrality (EBC). Node size is proportional to the NCC measure; node color ranging from blue (dark) to orange (bright) is proportional to the NBC measure; edge thickness is proportional to the EBC measure. Sign of the relationship: a bright orange edge denotes positive relations between nodes, while a dark blue edge represents negative relations.

