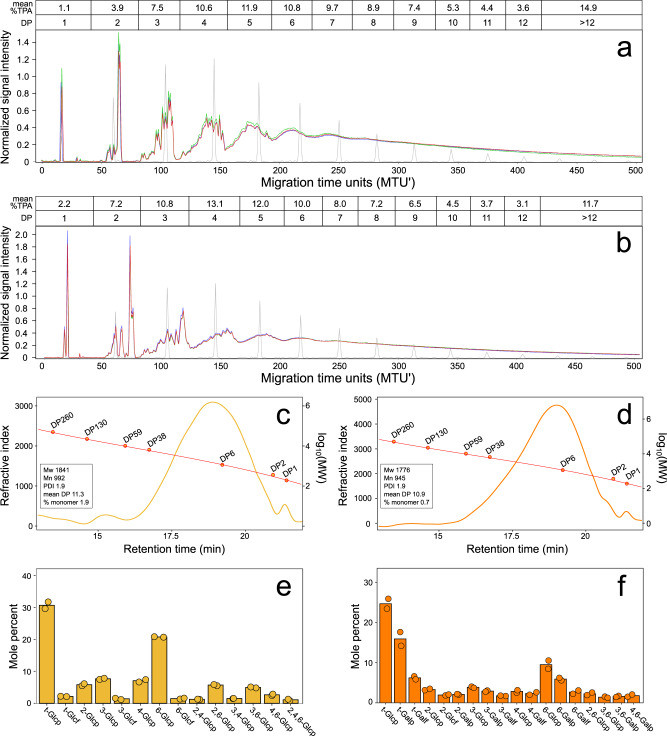
Fig. 5. Structural features of SGs.
xCGE-LIF analysis of the DP of (a) BRF and (b) BQM. Triplicate measurements of each SG (red, green, purple) and oligo-maltose standards (gray) are shown relative to normalized migration time units (MTU’). The mean percent TPA at each DP is above the plots. SEC chromatograms of (c) BRF and (d) BQM showing distributions relative to molecular weight (MW) standards with insets showing polymerization parameters. Refractive index in millivolts and molecular weights in Daltons. e–f Abundances (mole percent) of monosaccharides with different glycosidic linkages in (e) BRF and (f) BQM. Labels show all linkage types at >1% mole percent with residues linked only at 1- position as terminal “t-” residues. Bars show means and points show measurements for independent syntheses of each glycan. Source data are provided as a Source Data file. SGs Synthetic Glycans, xCGE-LIF multiplexed capillary gel electrophoresis with laser-induced fluorescence detection, DP degree of polymerization, TPA total peak area, SEC size exclusion chromatography, Mw weight average molecular weight, Mn number average molecular weight, PDI polydispersity index, Glcp glucopyranose, Glcf glucofuranose, Galp galactopyranose, Galf galactofuranose.

