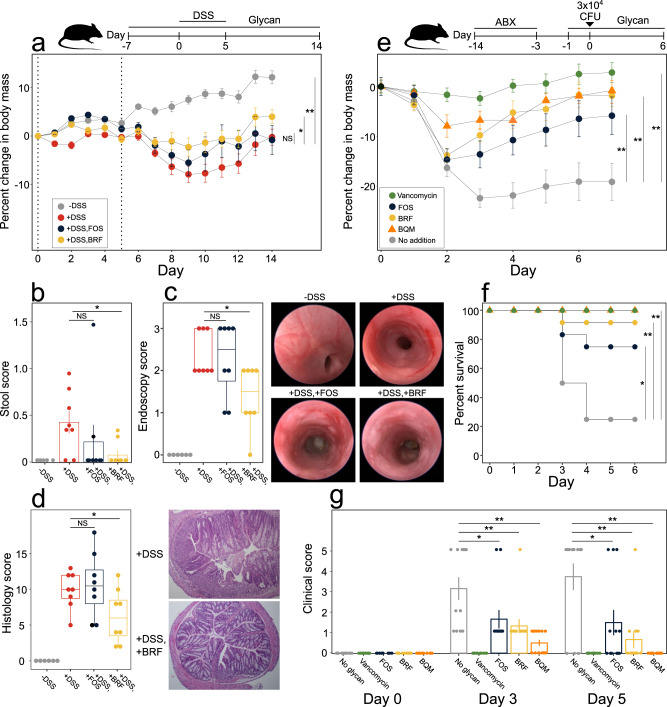
Fig. 6. Glycan effects in mouse models of DSS colitis and C. difficile infection.
a–d Mice were treated in drinking water with 2.5% DSS (days 0–5, dashed lines) and 1% (v/v) glycans (days 7–14), as appropriate. Treatment groups (eight animals per group): −DSS (gray), +DSS (red), +DSS, FOS (indigo), +DSS, BRF (yellow). Treatment group comparisons of (a) body weight, (b) stool score averaged over days 0–14, (c) day 14 endoscopy scores with representative images, and (d) day 14 histology scores with representative 100x magnified H&E stained distal colon micrographs. e–g Mice were treated with antibiotics (days -14–3), infected with C. difficile (day 0), and treated with 50 mg kg−1 vancomycin daily (days 0–4) or 1% (v/v) glycans in drinking water (days 1–6), as appropriate. Treatment groups (12 animals per group): no glycan (gray), vancomycin (green), FOS (indigo), BRF (yellow circles), and BQM (orange triangles). Treatment group comparisons of (e) body weight, (f) survival, and (g) clinical scores. Data in (a, b, e, g) show treatment group means ± SEM. Box plots in (c, d) show median and interquartile range. Data points in (b–d, g) show individual mice. a, e Statistics on body mass changes are based on area under the curve for all individual mice. Asterisks show significance (*p < 0.05, **p < 0.01) by (a–e, g) two-sided Wilcoxon rank-sum test or (f) log-rank test. Source data are provided as a Source Data file. DSS dextran sodium sulfate, FOS fructo-oligosaccharides, ABX antibiotics, CFU colony forming units, SEM standard error of the mean, NS non-significant.

