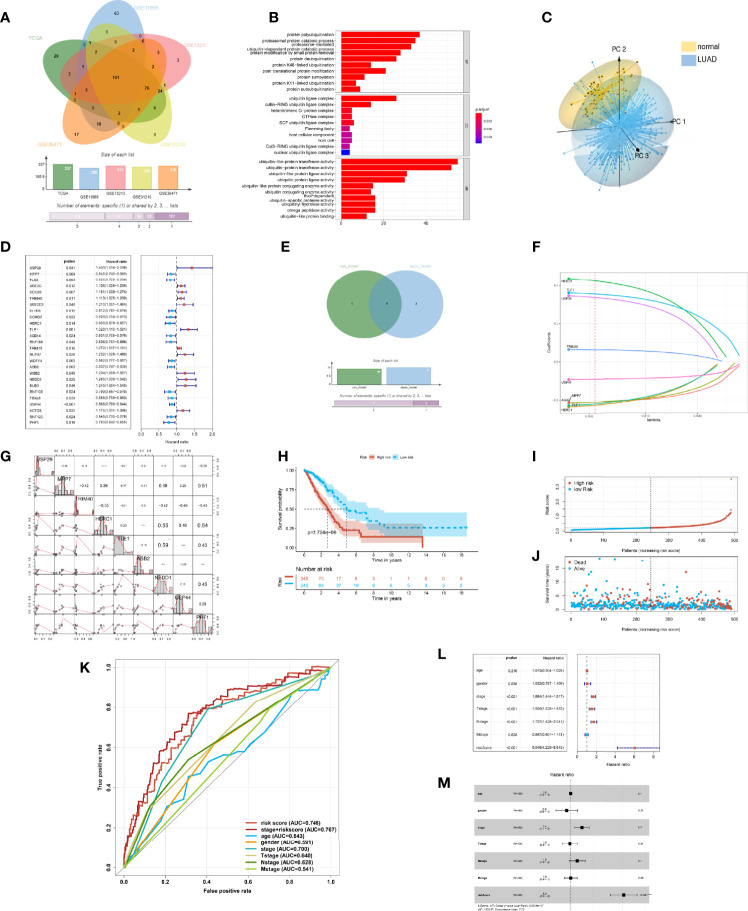
Figure 2.
Construction of the prognostic risk model of ubiquitination in the lung adenocarcinoma (LUAD). (A) Ubiquitination-associated genes co-expressed in The Cancer Genome Atlas (TCGA), GSE13213, GSE31210, GSE36471, and GSE11969 datasets. (B) Bar plot of the Gene Ontology enrichment analysis of ubiquitin genes. (C) 3D principal component analysis plot of ubiquitin genes in LUAD and adjacent tissue. (D) Statistically significant (p < 0.05) Ubi genes of the prognostic model based on univariate Cox proportion hazards regression. (E) Venn plot intersecting genes of the LASSO model and multivariate Cox model. (F) LASSO plot of 9 genes with ubiquitination LASSO model. (G) Correlation of the Ubi genes of the prognostic risk model. (H) Kaplan–Meier curve of the high- and low-risk groups of TCGA-LUAD. (I) Risk score of the LASSO prognostic model. (J) Risk state of the LASSO prognostic model. (K) Receiver operating characteristic curve of the risk score and other clinical factors for TCGA-LUAD. (L) Forest plot of the univariate Cox regression analysis of the risk score and clinical factors for TCGA-LUAD. (M) Forest plot of the multivariate Cox regression analysis of the risk score and clinical factors for TCGA-LUAD.

